AhnLab, South Korea
Copyright © 2016 Virus Bulletin
Given the rapid growth of Android applications and malware, the use of behaviour-based methods is one of the most promising approaches for malware detection. Many security researchers are struggling with how to determine malicious behaviours and identify malware. The visualization of executables is one of the most effective ways to identify malware. However, there is no well-known or generic way for security researchers to visualize the behaviours of Android applications and malware.
In this paper, I will explain how the behaviours of Dalvik executables can be visualized effectively by DEVIL (also known as Dex Visualizer), a graph-based approach for visualizing the flow of various Dalvik objects, typically classes. Currently, DEVIL uses only information from static analysis but it can easily be adapted to integrate information from dynamic analysis. The paper will focus on how to generate inter-object relationships and visualize a graph of those relationships. For example, inter-object relationships can be generated by tracing so-called Android Application Lifecycle triggers, which could be Android APIs, permissions, intents and so on. A graph of the inter-object relationships is visualized using a force-directed layout algorithm of the d3.js framework.
Finally, I will demonstrate some results of force-directed graph visualization of Android malware and will finish with some examples of how DEVIL could be applied in detecting Android malware.
The use of behaviour-based methods is one of the most promising approaches for the detection of Android malware. Many security researchers are struggling with how to determine malicious behaviours and identify Android malware.
Over the past few years, Android security researchers have been investing quite a lot of time and effort into the creation of Android sandboxes. Most of them are based on dynamic analysis, and output many logs about file and network operations. We have taken it for granted that the behaviours of an Android app can be identified easily by investigating file and network operations. This leads to frequent misunderstandings about behaviour-based detection. Ideally, the behaviours of an executable could be identified effectively by tracking down the flows of code. However, it is not an easy task to monitor and log all kinds of code operations.
In this paper, I attempt to show how the behaviours of an Android app can be shown as inter-object relationships via static code analysis, instead of monitoring file and network operations. I will discuss how to visualize the graph of inter-object relationships, and I will finish up with some examples that show how effectively a well-drawn behavioural graph can be applied in detecting Android malware.
Every Android app has essential building blocks known as app components. Each component serves a distinct purpose and has a distinct lifecycle that defines how that component is created and destroyed. Some interact each other, some depend on each other. These relationships between the app components construct the lifecycle of an Android app. Figuring out the app lifecycle of an Android app is much more important than investigating a few interesting code blocks of app components.
However, with a rapidly increasing volume of Android malware, daily Android malware responses are apt to be the repetitive and tedious hunting for suspicious code. As the saying goes, we can't see the wood for the trees. In order to see the wood, we need to build an automated analysis system that can assist our intelligence. In addition, visualization in the age of automated malware analysis can heighten the senses of our intelligence researchers who may be blinded by a deluge of malware.
With the motivations described above, in March 2014 I began to write small scripts in Python and JavaScript for personal use. I used various open-source libraries in my personal pilot, including Flask, jquery, androguard, d3.js and more. As my pilot matured, I named it 'DEVIL', also known as 'Dex Visualizer'. It was made available to my co-workers later the same year, and by early 2015, we were using a beta version of DEVIL heavily at work on a daily basis while researching Android malware samples. Figure 1 shows a simple representation of the construction of DEVIL.
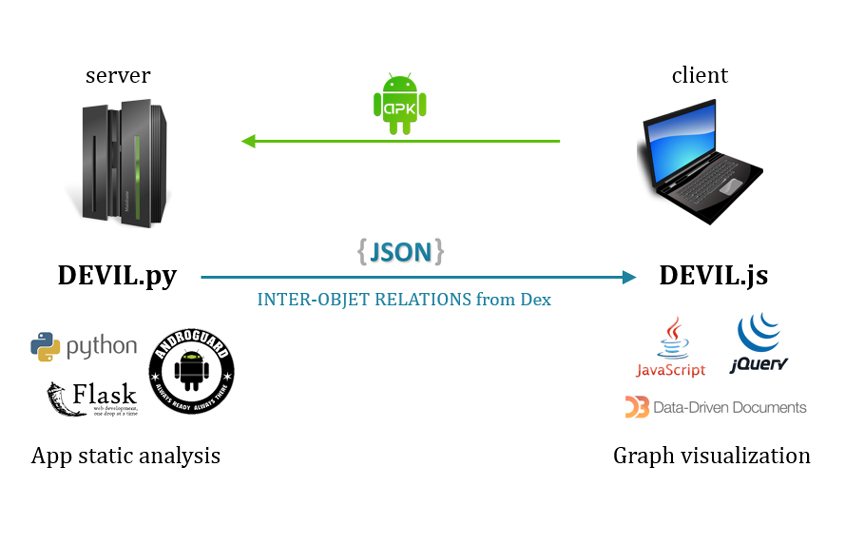
Figure 1: The construction of DEVIL (Dex Visualizer).
As can be seen in Figure 1, DEVIL has a simple client-server architecture. DEVIL.py is running on the WSGI HTTP server configured with both Flask and gunicorn. A user can submit an Android application package (APK) file to the server, and the server sends a JSON response that contains the inter-object relationships generated from the Dex file. On the client side, DEVIL.js renders the app lifecycle graph using the force-directed layout algorithm of d3.js. Before rendering the app lifecycle graph, the relational data sent from the server is transformed into the nodes and link data structures that are mandatory in a force-directed layout. In fact, DEVIL has a variety of features other than the graph visualization, but we only deal with the features related to the graph visualization, because most of the other features are implemented to help us analyse Android apps in efficient ways and eventually implement the visualization engine.
As mentioned, the relationships between app components – of which there are four different types –are the basis of the app lifecycle. The four components alone, however, are not enough to reveal the behaviours of an Android app. They can only show a high-level view in the best case. DEVIL uses the app components only as the seed nodes of the app lifecycle graph. It then generates the relationships between the app components and other meaningful objects such as intents, permissions, threads and more, using static code analysis. However, it is not an easy job to discuss the low-level technical details all at once. To make our life simpler, we will take a simple, fictitious malware sample, and walk through the realization of its app lifecycle graph, step by step. The fictitious malware, Android-Test/PNStealer, steals IMEI and phone numbers and sends stolen data to a specific email address. Figure 2 shows the app lifecycle graph of Android-Test/PNStealer.
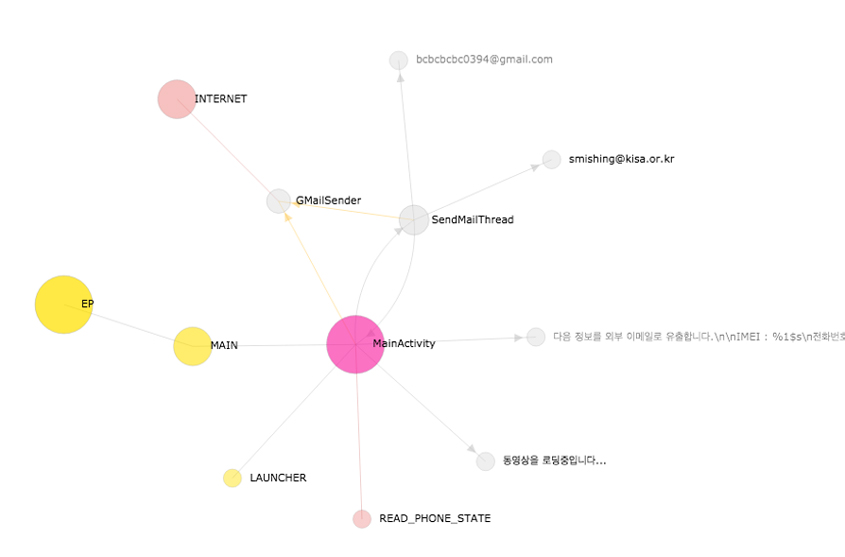 Figure 2: App lifecycle graph of the fictitious Android-Test/PNStealer.
Initially, the app lifecycle graph has only one abstract node, the EP (entry point) node (see Figure 3). As will be seen later, the EP node plays a more important role than any others, so it has quite a large radius and is depicted in gold.
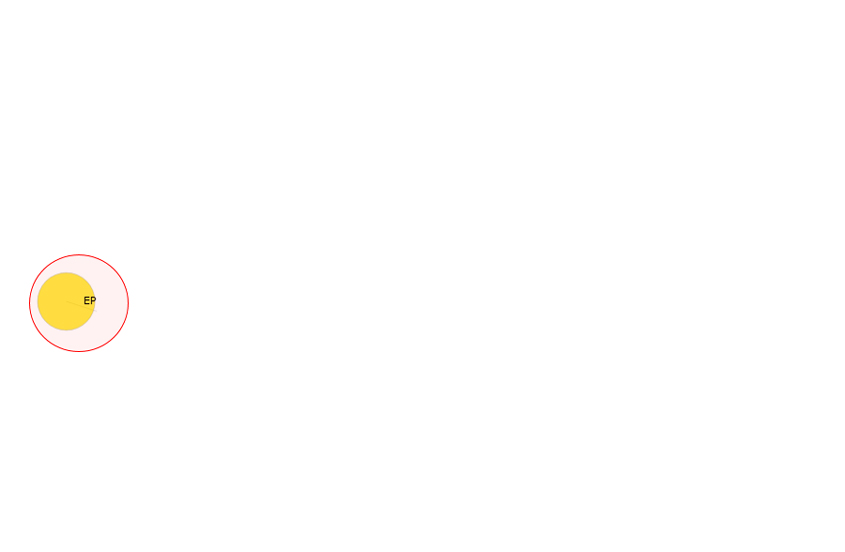 Figure 3: The initial state of the app lifecycle graph.
Next, the intent nodes are added to the graph (see Figure 4). The intent-related information can be acquired via two techniques. One is reading from the AndroidManifest.xml file, and the other is analysing the Dalvik bytecodes of the Dex file. The former is just a straightforward read operation, while the latter needs to be dealt with differently. DEVIL emulates Dalvik bytecodes, with the goal being to trace the life of objects we are interested in. For example, the intent object is the most important, because its main role is as the trigger for activating the app component.
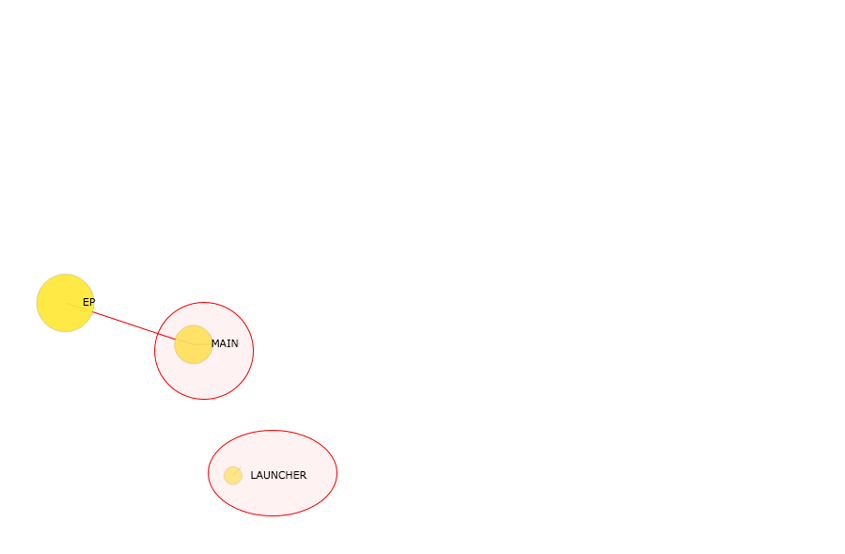 Figure 4: Intent nodes added to app lifecycle graph.
Back to the graph, the MAIN intent node refers to the ACTION_MAIN action which indicates that this is the main entry point and it does not expect any intent data. The LAUNCHER intent node refers to the CATEGORY_LAUNCHER category, which indicates that this activity's icon should be placed in the system's app launcher. Accordingly, the MAIN and LAUNCHER intent nodes have the same colour as the EP node to which the MAIN node is connected.
Note that, universally on the app lifecycle graph, the larger the radius of a node, the more noteworthy behaviours it has. Similarly, the more edges a node has, the larger radius it has. So, in Figure 4, the EP node is larger than the MAIN node, and the MAIN node is larger than the LAUNCHER node.
Next, the permission nodes are added to the graph (see Figure 5). All the permissions an Android app requires must be declared in the AndroidManifest.xml file. But as the manifest file could declare literally just a list of required permissions, DEVIL tracks down all the details of those permission usages via static code analysis and a type of propagation algorithm. On the app lifecycle graph, the permission node is depicted in red.
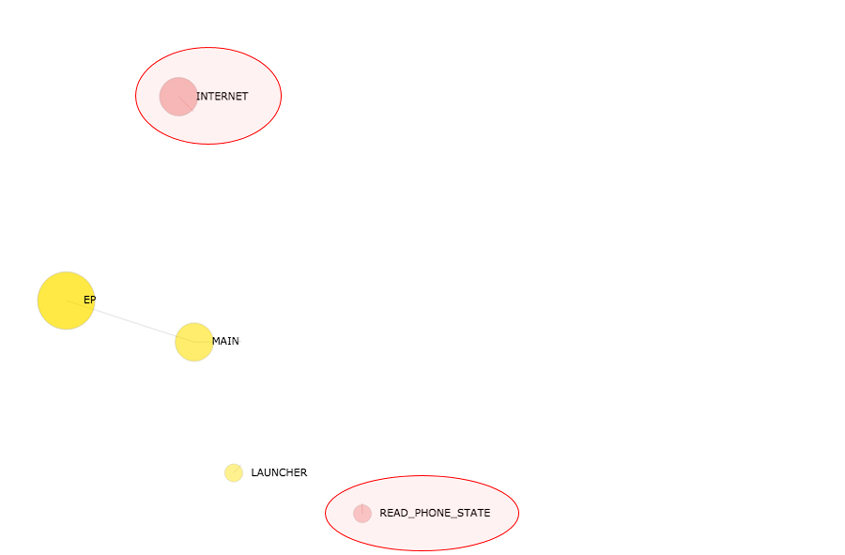 Figure 5: Permission nodes added to app lifecycle graph.
In Figure 5, the INTERNET node is larger than the READ_PHONE_STATE node. In other words, DEVIL considers the INTERNET permission more important than the READ_PHONE_STATE permission.
Next, the app component nodes are added to the graph (see Figure 6). Every Android app has app components. There are four different types: activities, services, content providers and broadcast receivers. Before the Android system can start an app component, the system must know that the component exists by reading the app's AndroidManifest.xml file. However, it is not enough to depend on the manifest file, because single Dex files are submitted as malware samples every day. DEVIL extracts the app component classes by parsing the Dex header. This is done simply by inspecting whether a class extends or implements the android.app.Activity class, android.app.Service class, android.content.ContentProvider class, android.content.BroadcastReceiver class and the like. This technique is a better method than using the manifest file, due to the fact that the app components of some well-crafted pieces of malware are not declared in the manifest file but registered dynamically at runtime.
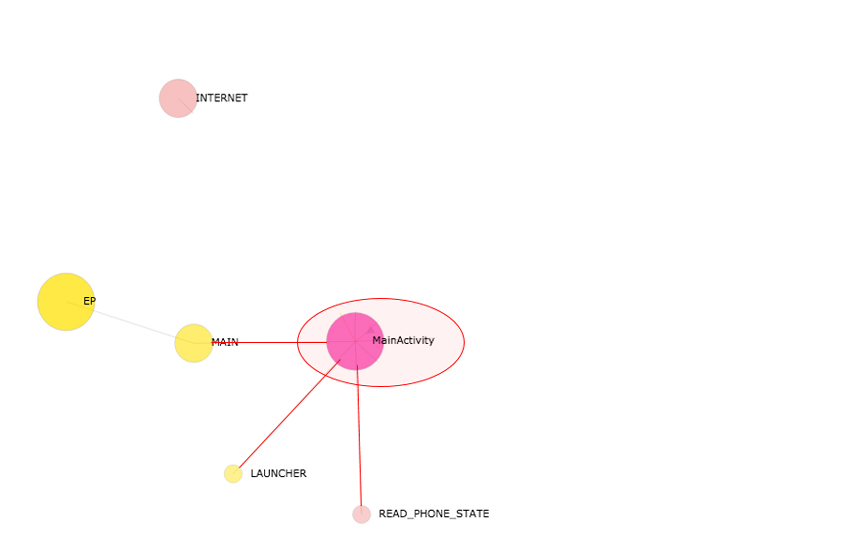 Figure 6: App component node added to app lifecycle graph.
Note that, in Figure 6, the MainActivity class node is depicted in hot pink as it is the main entry point.
In Android you should not block the UI thread. If you have operations to perform that are not instantaneous, you should make sure they are done in separate threads. This applies to Android malware as well. The design patterns are so vital that the long-running behaviours of Android malware must be implemented in separate threads.
Hence, we add the runnable component nodes to the graph (see Figure 7). DEVIL defines the runnable component class as a class extending or implementing java.lang.Thread class, java.lang.Runnable class and android.os.AsycTask class and the like. However, there are more. Only the named runnable components are added to the app lifecycle graph.
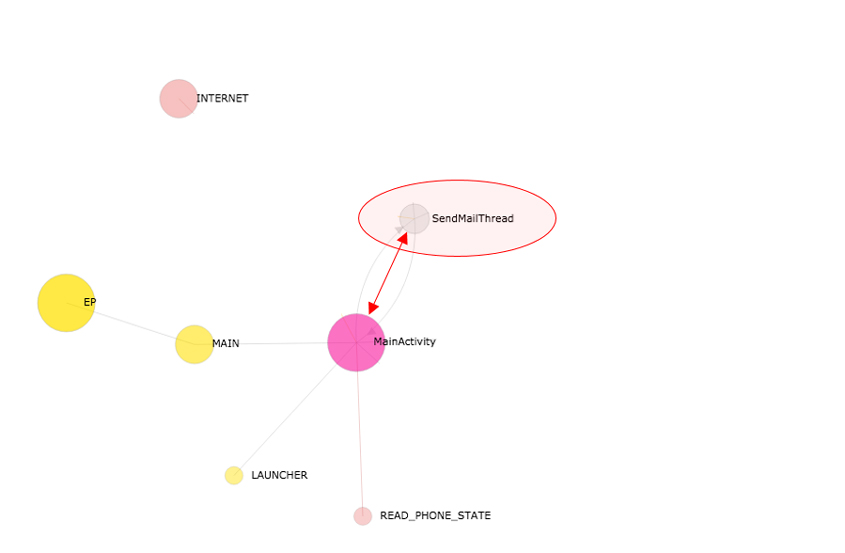 Figure 7: Runnable component node added to app lifecycle graph.
Note that, universally on the app lifecycle graph, the class nodes are depicted in grey.
Next, the import nodes are added to the graph (see Figure 8). While analysing any binary codes, cross-reference information is more useful than one could imagine, to outline the functionalities of the executable. For instance, if we are to reverse engineer a Portable Executable (PE) file, it is crucial to understand the import sections of it. Unfortunately, the import-section-like information is not located in any specific sections of the Dex file header. We must discover the import classes of Dex for ourselves. As mentioned, the app components play a significant role for the seed nodes of an app lifecycle graph. Accordingly, DEVIL defines the import class as a class referenced by the app components. An import class could also have its own imports recursively.
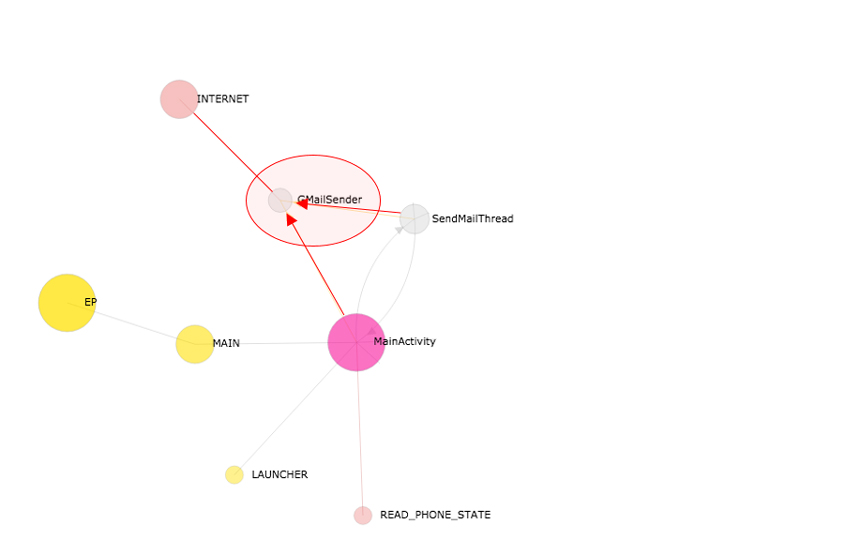 Figure 8: Import nodes added to app lifecycle graph.
In Figure 8, the GMailSender class is imported from both the MainActivity class and the SendMainThread class.
Next, the string nodes are added to the graph (see Figure 9). While DEVIL emulates Dalvik bytecode, the virtual Java string objects mimicking the java.lang.String, java.lang.StringBuilder, java.lang.StringBuffer classes and more, are maintained. Then, should the virtual Java string object be referenced as a parameter in the invoke commands related to either the app components or the imports, DEVIL will generate the relationship between the text of the object and the class in which the invoke commands are issued. However, the string node has one more restriction in that the text of the object is meaningful, containing, for example, a URL, email or text that specifies important keywords and so on.
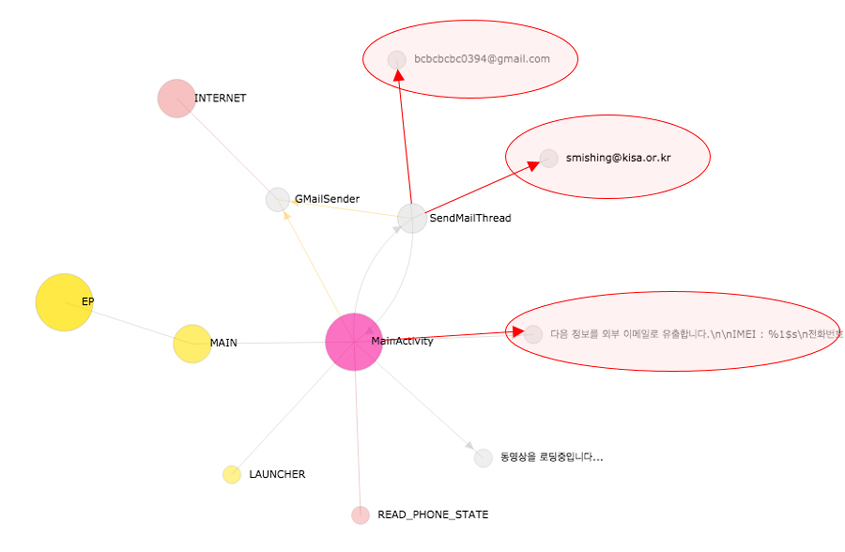 Figure 9: String nodes added to app lifecycle graph.
In Figure 9, from the top, one URL, one email and one keyword node are added.
So far we have focused on how to build the app lifecycle graph. From now on we will discuss how effectively the app lifecycle graph can be applied in detecting Android malware. Prior to seeing the real-world malware samples in a case study, we should have a general idea of the app lifecycling. The app lifecycling could simply be put as: traversing all outgoing nodes from one node on the app lifecycle graph recursively, typically from entry points, until there are no more nodes to visit. Yes, it is all about traversing a graph. However, as we will see in the next section, app lifecycling is very useful for investigating the behaviours of an Android app. It is also very effective for identifying a distinct behaviour of an Android app. Therefore it is well suited to detecting the suspicious behaviours of Android malware. In Figure 10, the bold red lines with arrow heads show our first app lifecycling.
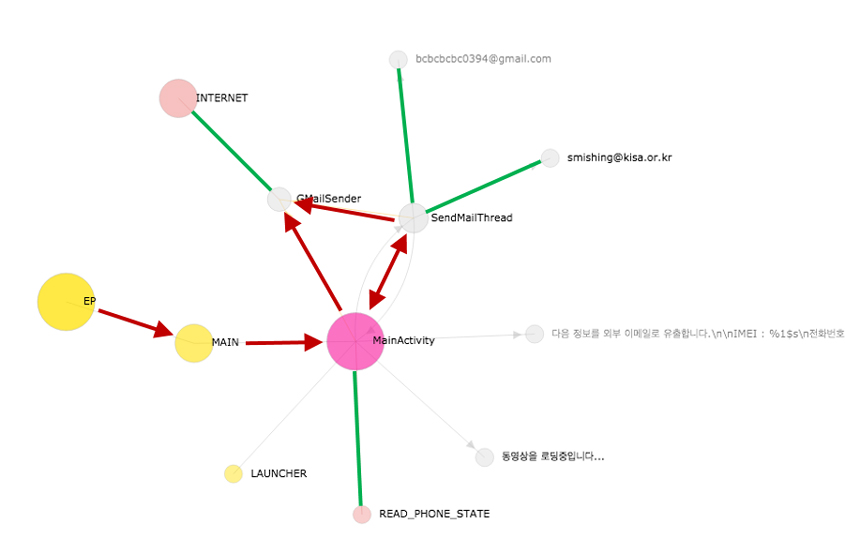 Figure 10: App lifecycling of Android-Test/PNStealer.
The increasing number of Android malware samples seen every day has overwhelmed the manpower available to analyse and classify them. The most challenging task is to pick out small, unusual patterns from giant piles of binary code. It is like finding a needle in a haystack. In the following case studies, we will address at length these kind of problems. A few walk-throughs of real-world malware samples will show some new perspectives, and eventually tell a story of how effectively a well-drawn graph could be used in finding unusual patterns and making a reasoned assumption about malicious behaviours.
Figure 11 shows the app lifecycle graph of Android-Trojan/Narut (A). It is clear that the MainActivity class is the main entry point of this malware sample, as it is connected to the MAIN and the LAUNCHER intent nodes. The one outgoing edge from the MainActivity class node points to the InstallService class node, which means that the MainActivity class starts the InstallService class. The InstallService class node is connected to the READ_LOGS permission node. This means that the InstallService class requires the android.permission.READ_LOGS permission, which allows an application to read the low-level system log files. Also, the InstallService class node has an outgoing edge to the application/vnd.android.package-archive MIME type node, which means that the InstallService class has the functionality of downloading an APK file. Finally, the InstallService class node has three more outgoing edges to the string nodes labelled 'exec', 'chmod 777' and 'pm install -r getPath()', which means that the InstallService class executes those commands.
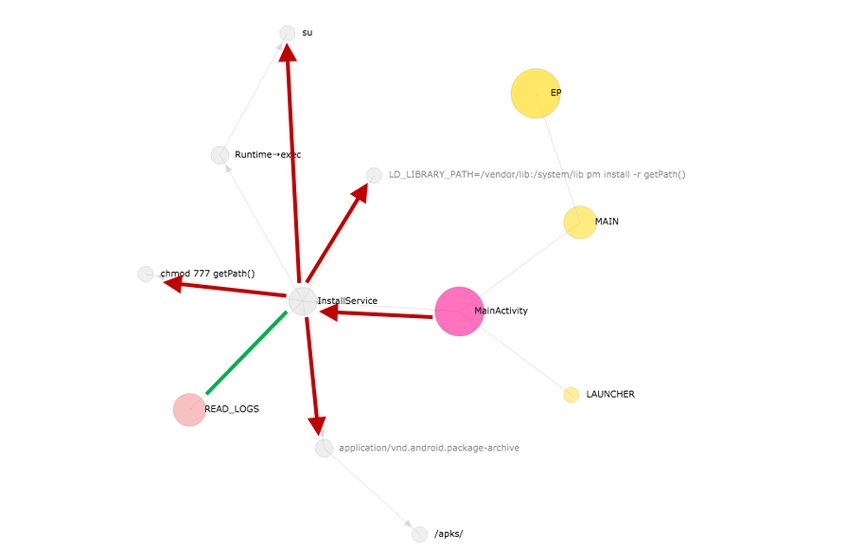 Figure 11: App lifecycle graph of Android-Trojan/Narut (A).
In a nutshell, Android-Trojan/Narut (A) requires one unusual permission, and if it starts, it downloads and installs one APK file. Above everything else, the app lifecycling of Android-Trojan/Narut (A) has the complete coverage of the app lifecycle graph. Putting together all of behaviours we have seen, we can say that Android-Trojan/Narut (A) is certainly malicious.
Note that all the work has been done without investigating any binary code but simply by reading the app lifecycle graph of the malware.
Figure 12 shows the app lifecycle graph of Android-Trojan/KorTalk. This malware sample has some distinct characteristics, such as accessing the SMS inbox, hiding the app icon in the Launcher, and registering a DeviceAdminReceiver, all at the beginning. The MainActivity class node has two outgoing edges to the string nodes labelled as the address beginning with content://sms/, which explains the behaviour of accessing the SMS inbox. The CHANGE_COMPONENT_ENABLED_STATE permission is required by the MainActivity class, which explains the hiding of the app icon in the Launcher. Finally, the DEVICE_ADMIN_ENABLE intent node has an incoming edge from the MainActivity class node and has an outgoing edge to the LSecScreen class node, which requires the BIND_DEVICE_ADMIN permission. This tells us that the MainActivity class registers the LSecScreen class as a DeviceAdminReceiver. As seen, even just a simple picture with nine nodes and eight edges, or internally a list of eight inter-object relations, can represent over three malicious behaviours very well.
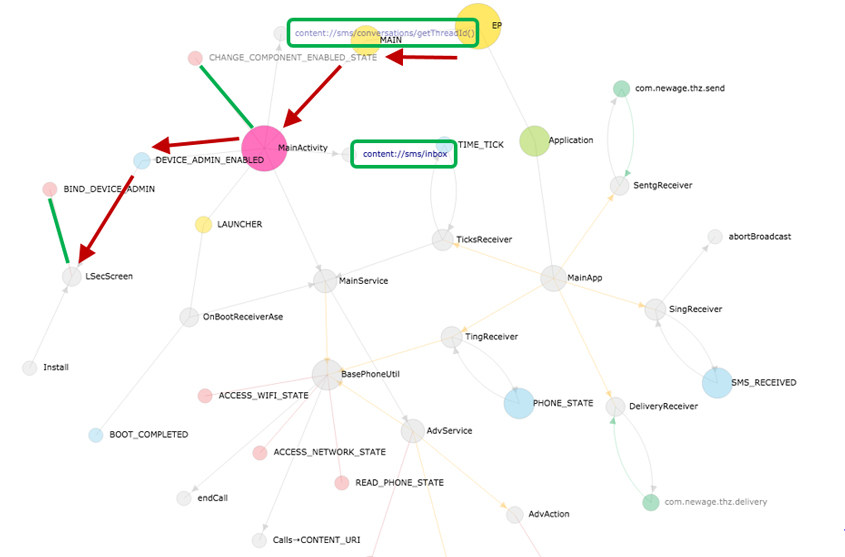 Figure 12: App lifecycle graph of Android-Trojan/KorTalk.
Next, the Android-Trojan/KorTalk malware sample has the MainApp class extending the Application class. On the app lifecycle graph, the inheritance of class is represented by the node in a yellow-green colour. The Android reference describes the Application class as the 'Base class for those who need to maintain global application state. You can provide your own implementation by specifying its name in your AndroidManifest.xml's <application> tag, which will cause that class to be instantiated for you when the process for your application/package is created.' As the context of the entire application, the Application class will be the starting point when executing the program.
In Figure 13, therefore, the EP node and the Application class node are connected to each other. The MainApp class references five receivers in total: SentgReceiver, SingReceiver, DeliveryReceiver, TingReceiver and TickReceiver class. At the very beginning of the app, even before the main activity is created and UIs are seen by the user, Android-Trojan/KorTalk calls the five receivers in a stealthy way. The five receivers also have both an outgoing edge to and an incoming edge from their own intent action nodes, which means that all five receivers register themselves as the broadcast receiver. The behaviours of the MainApp class are clearly malicious, and the app lifecycle graph makes an intricate story quite simple in a manner never seen before.
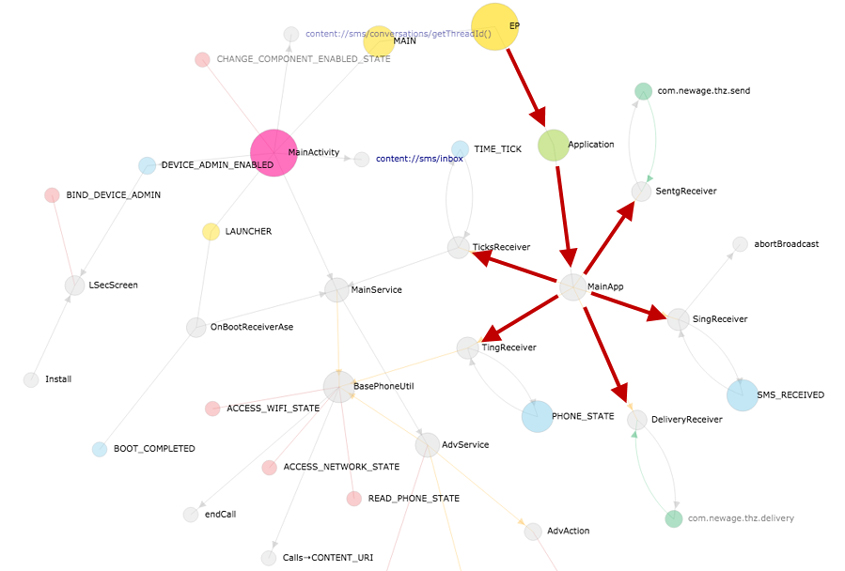 Figure 13: App lifecycle graph of Android-Trojan/KorTalk.
Figure 14 shows the app lifecycle graph of Android-Trojan/Narut (B). This malware sample has no main activity, generally declared as MAIN in AndroidManifest.xml. Instead, it has an unusual entry point: the App class extending the Application class. We have already seen this characteristic in the case of Android-Trojan/KorTalk. In this case, the App class references the DexClassLoader class directly or by importing the Util class to realize the dynamic class loading. The App class also references the ACall class for loading the native library named 'secexe'. Finally, the Util class imported by both the App class and the ACall class requires the READ_LOGS permission and executes chmod and kill commands.
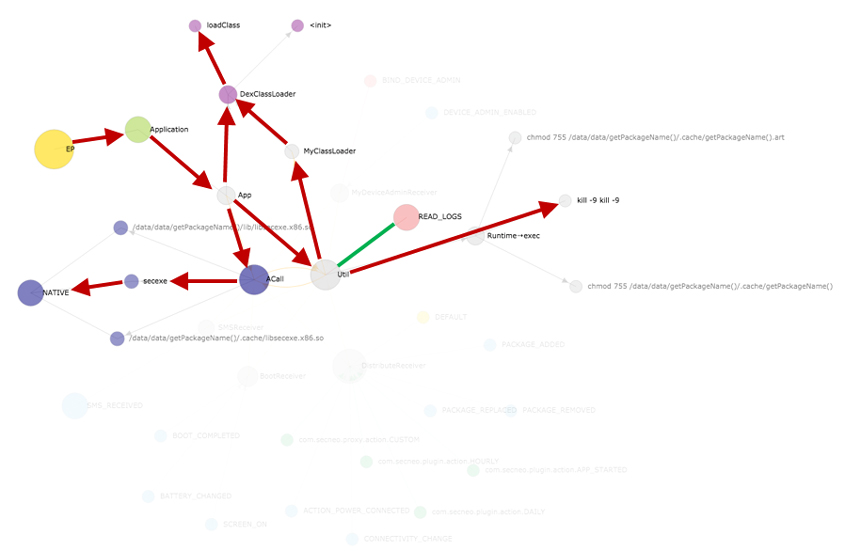 Figure 14: App lifecycle graph of Android-Trojan/Narut (B).
These behaviours, on the whole, are the distinct features of notorious packers in Android, and the app lifecycle graph does represent their behaviours very well. Of course, we cannot use visualization to unpack the malicious apps being packed, but we can use visualization to readily identify and classify both known and unknown packed malware.
Figure 15 shows the app lifecycle graph of Android-Trojan/Bankun. This malware sample has interesting characteristics in that one broadcast receiver, the 'a' class in Figure 15, has too many intent actions. We can find this unusual feature by reading the AndroidManifest.xml file, and of course by viewing the app lifecycle graph. The latter can tell the same story in less boring and more representative ways.
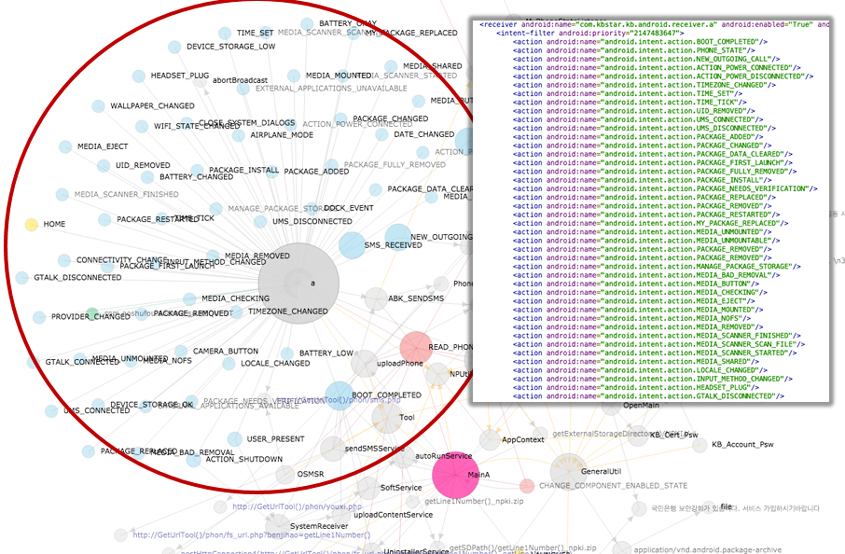 Figure 15: App lifecycle graph of Android-Trojan/Bankun.
On the app lifecycle graph, the sky-blue-coloured nodes represent the intent actions as mentioned. In this case, most of the intent actions are connected to the 'a' class. Accordingly, the radius of the 'a' class node has grown to the largest of all. Furthermore, force layout algorithms naturally expand the range of the 'a' class node and its intent action nodes to the largest of all, too.
When there are many prevalent variants of one piece of malware, we should dig out the common characteristics of the family and then contain the whole malware family as efficiently as possible. In this case, an app lifecycle graph could make our lives easier and more productive.
Figure 16 represents the infamous Android-Trojan/Dendroid malware family. Dendroid is a custom Remote Access Toolkit (RAT) for Android. A RAT is a type of malware that is used to remotely control the devices on which it is installed. The toolkit is being sold for $300 to anyone who wants to automate the malware distribution process. The creator promises that the malware can take pictures using the phone's camera, record audio and video, download existing pictures, record calls, send texts, and more. The Dendroid malware family has so many functions that it leads to a heavy workload for security researchers.
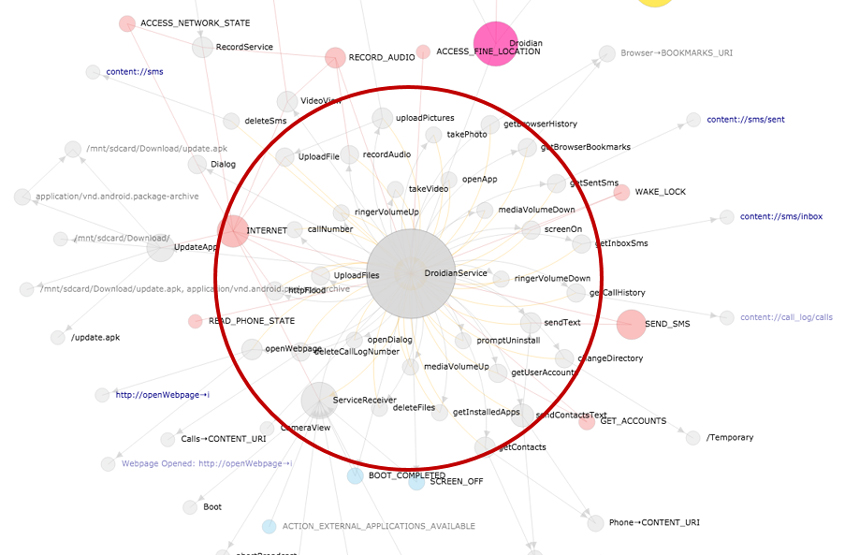 Figure 16: App lifecycle graph of Android-Trojan/Dendroid.
With the app lifecycle graph, however, it would take much less time and effort to determine a sample as being an Android-Trojan/Dendroid variant. Every Android-Trojan/Dendroid variant has a large, sunflower-shaped subgraph in the centre of its app lifecycle graph. So to speak, all Android-Trojan/Dendroid variants have many cross-references to their inner classes, which implement the majority of its malicious behaviours. This characteristic gives the sunflower-like shape to the app lifecycle graphs, even if they have been heavily obfuscated.
Humans tend to perceive and remember the world in images, and malware researchers are no exception. They can perceive and remember malware samples in images. Moreover, if you have a well-made visualization engine like DEVIL in your arsenal, it would become much easier to identify new malware with your own senses. For example, if you encounter new samples which have a subgraph that is very similar to that of Android-Trojan/Dendroid, you can assume it is malicious and predict the malware family it might belong to.
Of all types of Android malware, identifying a piece of repackaging malware is more challenging than any others. But in this case if we could make the best of the app lifecycle graph, we would make the detection as simple as it gets. To cut a long story short, by comparing the graph of a legitimate app with that of suspicious ones, their maliciousness could easily be revealed.
In Figure 17, the graph on the left-hand side is that of a legitimate app, BounceBall, while the graph on the right-hand side is that of a repackaged one, Android-Backdoor/SMSMonitor. Take a closer look at the two graphs. They have the main entry point, BounceBallActivity class, in common, which is highlighted in the green box. In addition, Android-Backdoor/SMSMonitor has one more graph independent of the main entry point, which is highlighted in the red box. On the additional graph, which is unseen in a legitimate app, the broadcast receiver, SMSMonitor class, plays a role as another entry point that receives the SMS_RECEIVED intent, requires the INTERNET, READ_LOGS, READ_PHONE_STATE and ACCESS_FINE_LOCATION permissions, and performs an abortBroadcast(). The user will never see the SMS, which will not appear on his mobile phone. The SMSMonitor class also accesses phone numbers and pictures, and references the Recording class, which requires the RECORD_AUDIO permission. Finally, the SMSMonitor class visits two suspicious URLs ending with saveinfo.php and getinfo.
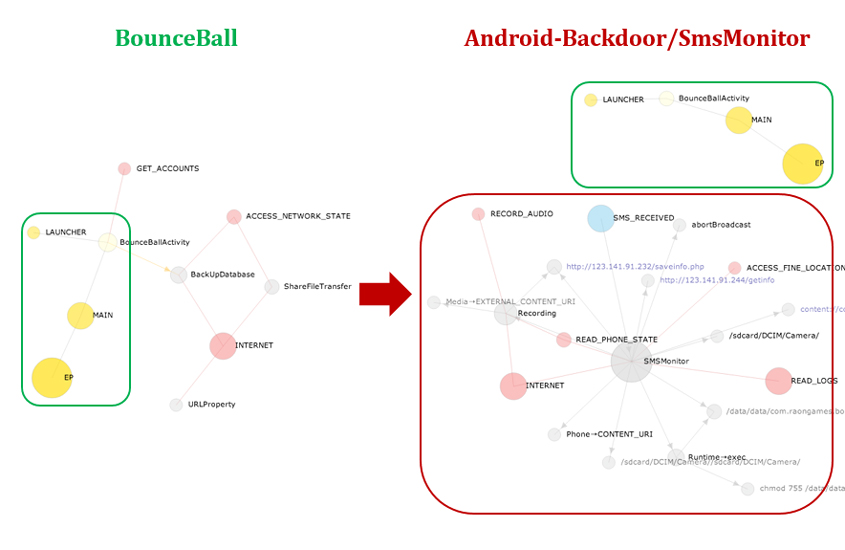 Figure 17: App lifecycle graphs of BounceBall and Android-Backdoor/SmsMonitor.
The comparison of the two app lifecycle graphs easily reveals both the common functionalities and the additional ones.
Every Android app has essential building blocks known as app components. The relationships between app components construct the app lifecycle, which can effectively be visualized in a graph using force-directed layout algorithms. The app lifecycle graph is well suited to analysing how an Android app operates. The app lifecycling traverses all outgoing nodes from one node on the app lifecycle graph recursively, typically from entry points, until there are no more nodes to visit. App lifecycling is useful for analysing the behaviours of an Android app. App lifecycling is so effective in identifying the distinct behaviours of an Android app that it can be used to detect the malicious behaviour of Android malware. By comparing the graph of a legitimate app with that of suspicious ones, we can also identify repackaging malware.
To sum up, the proper visualization of malware as performed by DEVIL (Dex Visualizer) could be a wonderful tool to provide insight into the behaviours of Android malware and can even heighten the senses of security researchers who are drowning in a deluge of rapidly increasing malware. As the saying goes, a picture is worth a thousand words.
[1] http://developer.android.com/reference/packages.html.
[2] https://github.com/androguard/androguard.
[3] http://d3js.org/.
[4] http://en.wikipedia.org/wiki/Force-directed_graph_drawing.
[5] http://cs.brown.edu/~rt/gdhandbook/chapters/force-directed.pdf.
![]()