ATG Group, Czech Technical University, Czech Republic
Copyright © 2015 Virus Bulletin
Current malware traffic detection solutions work mostly by using static fingerprints, white and black lists and
crowd-sourced threat intelligence analytics. These methods are useful for detecting known malware in real time, but are insufficient for detecting unknown malicious trends and attacks. Our proposed complementary solution is to analyse the inherent patterns of malware actions in the network by means of machine learning algorithms. In particular, we use Markov chains-based algorithms to find network patterns that are independent of static features, such as IP addresses or payloads. These patterns are used to build behavioural models of malware actions that are later used to detect similar traffic in the network. All these models and detection algorithms have been used to create a free software intrusion prevention system called Stratosphere IPS, which has been thoroughly tested with normal and malware traffic. The IPS is able to detect new network patterns that are similar to known malicious behaviours. The Stratosphere IPS tool will be used to show how behavioural models can detect real malware traffic.
Botnets are complex organizations of systems aiming to obtain profit. They are huge, interrelated and coordinated overlay networks of different components that work together to achieve different goals. Far from being simple structures that only have one botmaster with some command and control (C&C) channels and which perform simple attacks, botnets have became a large technological backbone of malicious activities [1]. Their complexity makes it difficult to define and explain precisely the actions of a botnet. They usually have several layers of services and servers, they download and install a large amount of different malware, they report to several C&C channels at the same time, they have various tamper-proof recovery methods and they are rented to anyone who pays for temporary control [2]. Consequently, the behaviour of botnets in the network is highly varied and sophisticated.
This research presents a new analysis of botnet actions over long periods of time to extract the most inherent characteristics of botnet behaviours. These characteristics are used to create accurate models of certain botnet actions. The models represent simplified versions of specific behaviours of a botnet, based on real data [3]. These models are used in our research to monitor the botnets and then to discuss potential detection methods and future designs of a behavioural firewall.
To create the models successfully it is necessary to use a real dataset. For this purpose we created the Malware Capture Facility Project (MCFP) [4], which consists of a group of virtual machines dedicated to running real botnets for several months. The datasets include botnet traffic, normal traffic from normal users, and background traffic from the rest of our university. More importantly, our datasets are labelled manually and are published for the community.
Our manual analysis of the dataset confirmed that botnets have a large number of complex behaviours, and that these behaviours are usually different and involve several protocols [5]. The analysis also led us to realize that the most important behaviours to be detected on a botnet are those of the C&C channels, because they are a key component of the communication infrastructure and they usually show a very defined network pattern [6].
The information gathered from the analysis of the dataset was used to create a model of the behaviour of certain actions of the botnet. At first we focused on the C&C channels, but we already have models of several other actions. The model identifies several states for the C&C channels and then represents the transitions between states as a chain. These models accurately represent the behaviour of the botnet [7] and can be used for several purposes. In this research we present a simple piece of monitoring software for botnet traffic that can identify the specific behaviours in real time.
The core of our work is the creation of a representation model for the behaviours of botnets in the network. It is based on the results of our manual and deep analysis of the botnet dataset captured in our MCFP project. In several of the captures we analysed how the C&C channels behaved. The most important lesson learned was that the traffic in a network can be very complex and therefore difficult to model. Most of the behavioural approaches to traffic analysis consider a single model for the whole network or a model for each protocol
[7, 8, 9]. But the traffic from one host, or even all the traffic of one protocol, can be so complex that the models fail to correctly represent the behaviours. To study the complexity of the traffic, we made a study of the behaviours seen in a bot. Figure 1 shows an analysis of the traffic of just one botnet over 57 days of operation. Each point in the figure is an aggregation of the sizes of all the flows of a certain type every 30 minutes. The different types of traffic include three command and control channels, several TCP actions, the DNS traffic of the bot, the connections to the www.google.com web server and the download of binary updates.
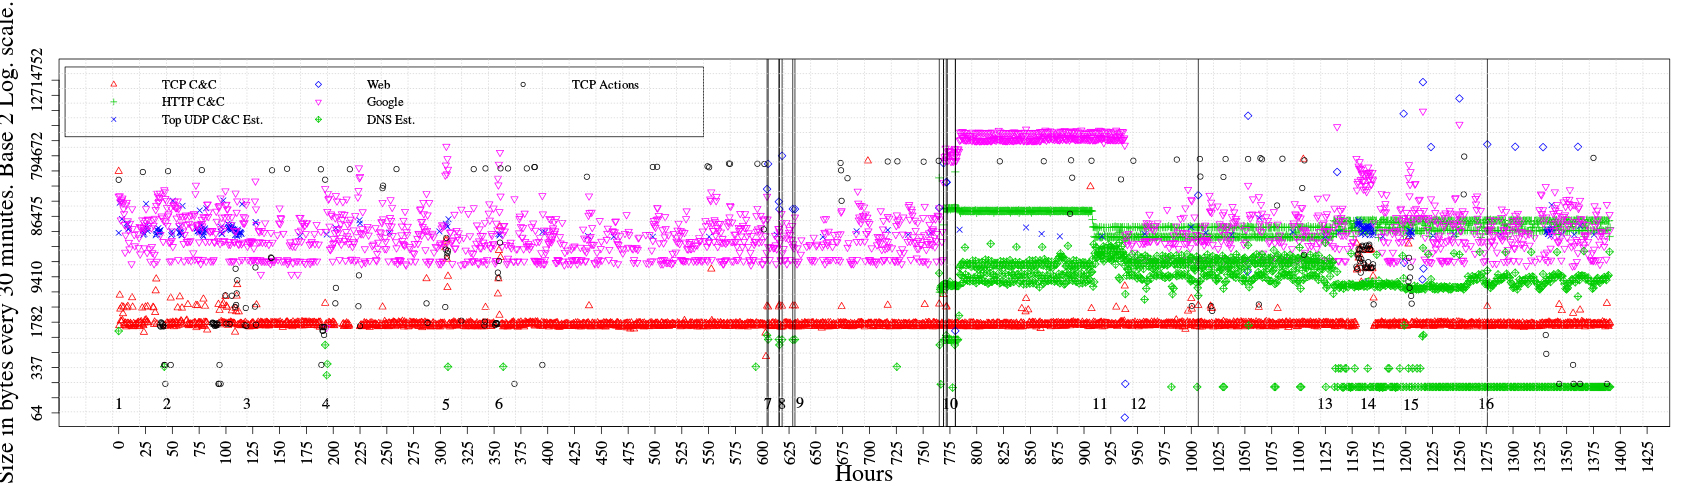
Figure 1: Traffic analysis of one botnet over 57 days. The data is the size in bytes every 30 minutes of the flows of the following botnet actions: HTTP CC, TCP CC, UDP CC, Google access, DNS, web and TCP actions.
In Figure 1, for example, it can be seen that the TCP command and control channel had similar sizes and volume of flows during the whole operation time of the botnet. From time to time, this TCP command and control channel had some bigger flows, meaning that some operation was being carried out. Near to the hour 1,150 it can be seen that for almost one day the TCP C&C channel was sending and receiving a lot of information. This shows how a single channel can have very different operations that are not easy to model and identify.
A better example of the complexity of the network traffic in a botnet can be seen in Figure 1 near the hour 775. The vertical lines at this point represent new binary downloads to the bot. After these new binaries the bot starts using a new C&C channel with the HTTP protocol. The action of creating a new C&C channel after 32 days of operation shows how complex this behaviour can be. The HTTP C&C channel was connecting to five different C&C servers and was using several different domains. This channel was encrypted and had been working for several days. It is interesting to note that the HTTP channel seemed to be far more stable than the UDP and TCP channels.
Based on the analysis of this bot it was possible to define certain states of the C&C channels. For example, for most of the time the C&C channels were working (i.e. they were not broken), idle (because they were not receiving orders) and periodic. From time to time, they became active because they received orders. After receiving the orders and probably starting to execute them, the C&C channels lose their periodicity. The C&C channels could also be in a broken state because of some technical issue in the botnet. However, even when broken, the channel still tends to be periodic. These changes in the state of a C&C channel were the basis of our behavioural model.
All the captures in our dataset were made in pcap files, but they were converted to bidirectional Argus [10] flows to take advantage of its great aggregation capabilities. Therefore, the input data for our behavioural model comprises bidirectional Argus flows formatted with the NetFlow standard.
Figure 2 shows an example of the bidirectional Argus flows that were captured in our Malware Capture Facility Project. It can be see that these flows are bidirectional, which is a great advantage in the analysis. The bidirectionality allows us to correctly identify and separate the client and the server in the connection. With this information it is possible to study the flows going to the bot and the flows going out of the bot. A convenient example of how important this separation is can be seen in a port scan activity: the host performing a port scan is not the same as if the host is being port scanned by others. The second advantage of bidirectional flows is that all the information regarding each action is aggregated in one flow. This allows us to have fewer flows and better information about each flow.
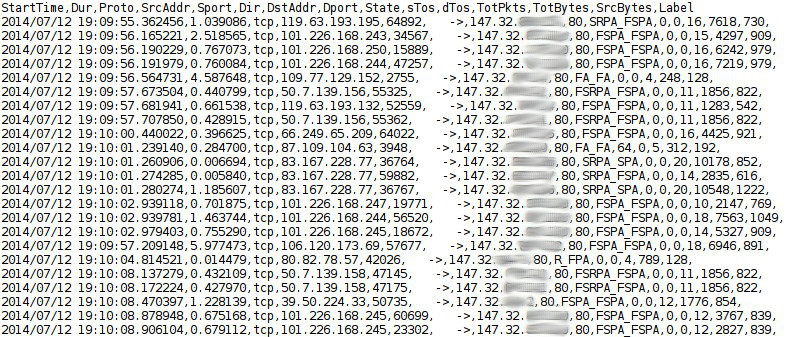 Figure 2: Example of the bidirectional Argus flows captured in the Malware Capture Facility Project.
Based on the flows in the network and the previously discussed states, we extract just three different features of each flow for our proposed behavioural analysis. The features are the size of the flow, the duration of the flow and the periodicity of the flow. The size of the flow is extracted directly from the size field in the flow. The duration is also extracted directly from the flow. However, the periodicity requires some computations. Figure 3 illustrates how this periodicity is computed. The goal of this feature is to capture the periodicity of the connections based on its flows, so the first step is to compute the time difference between the arriving flows (first order time difference or 1st TD). Then we compute the difference between these differences (second order time difference or 2nd TD) to obtain a number that is close to 0 when the flows are periodic, and far away from 0 (positive or negative) in other cases. The periodicity is computed using the second order time difference. Note that the first two flows of a connection do not have a TD.
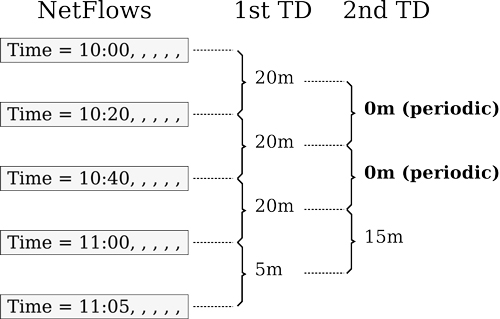
Figure 3: How to compute the second order time difference of the network flows. 1st TD is the first order time difference and 2nd TD is the second order time difference.
The behavioural model computes these three features for each flow: its size, its duration and its TD. However, in order to work with these features we need to discretize them. The discretization is done using two thresholds for each feature, effectively separating each feature in higher, medium and lower values. In the case of size, the thresholds differentiate between small, medium and big flows. In the case of duration, the thresholds differentiate between short, medium and long flows. And in the case of TD, the thresholds differentiate between strongly periodic, weakly periodic and non periodic flows. Where periodicity is concerned, there is also a special case when there is not enough data to compute any periodicity. The thresholds and the features separate 36 different states. Each connection can take one of these states at each specific moment. Each state is represented by a letter for simplicity. Figure 4 shows the assignment logic of letters. The logic is used to assign a state, represented by a letter, to a flow. It has been designed to use the letters ‘a’ to ‘i’ for periodic flows and letters ‘r’ to ‘z’ for non-periodic flows. The numbers represent a condition where there is not enough information to compute the periodicity, while the lower case letters from a to i represent strong periodic flows, and the upper case letters A to I represent weak periodic flows. Also in this schema, ‘0’ is used to indicate a timeout, i.e. when the time between flows is more than one hour.
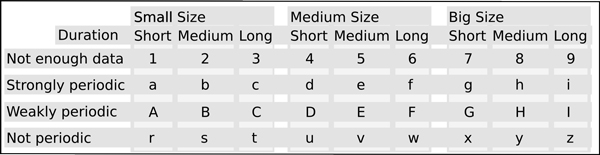
Figure 4: States that each flow can take depending its size, its duration, its TD and the thresholds.
With this assignment logic we can now give one letter to each flow in a connection. However, it is still necessary to define what a connection is. In a C&C channel the bot is usually generating a new connection at regular intervals, for example every hour. This means that every hour a new connection is made and each of these connections has a new source port to distinguish it. Each of these hourly connections is represented by a new flow. Therefore, a single flow cannot contain all the information about the complete C&C channel. Since we want to analyse the periodicity features of the C&C channel, we need to get all the flows together. Consequently, we aggregate all the flows of the same C&C channel by ignoring the source port. The new representation is called a 4-tuple and it consists of all the flows that share the same source IP address, destination IP address, destination port and protocol. For example, a 4-tuple might be 149.235.254.205-142.31.14.209-443-tcp.
The idea of using 4-tuples is that we can now have all the flows related to one behaviour together, and we can assign to each flow in the 4-tuple a letter of our behavioural model. An example assignment of letters for the 4-tuple 147.32.84.165-212.117.171.138-65500-tcp is as follows:
96iIIiFfiiIiiIIIfiIIIiiiiiiiiIfIiIIIiiiiIFiFIiwzwwzzIIiF0wzwzzfi0wwwwwzFzwFw0wwwwfiiw0wwzwww0wwwwwfwww0wwzwiwwwziwzwF0wwwfwwwwwwwwzzwzziifiiiiifdffwwz0wzwiidfFIFFdiDFIIwzziiiiwwzfwwweiFFwwFFwwFEfi0wwwwFf(...)
In this example we can see that the initial letters are for periodic flows, such as i, I, f and F. Then there are some timeouts with the number 0 and after that the flows start to become non-periodic. This is a good example of the complexity of the network communications in a botnet.
Another example of a chain of states for the 4-tuple 10.0.2.106-212.124.126.66-80-tcp is the following:
11aaaaaaaaaaabrrctrraaaAaaaaaAaaaaaaaaaaaaaaaaaAAAaaaaaaaaaaaaaaaaaaaAaAaaaaaaaaaaaaaaaaaaaaaaAAaaaaaaaaAAaaaaaaaaaaaaaaaaaaaaaaaaAAAAaaaaaaaaAAaaAAaaaaaaaaaaaaaaaaaaaaaAAaaaaaaaaaAAaaaaaaaaaaaaaaaaaaaaaaaaaaaaAAaAaaaaaaaaaaaaaaaaaaaaaaaaaaaaaaaaaaAaaaaaaaaaaaaaaaaaaaaaaaaaaaaaaaaAAaaaaaaaaaaaaaaaaaaaaAAaaaaaaaaAaaAAAAAAAAaaaaaaaaaaaaaaaaaaaaaaaaaaaaa(...)
According to the assignment logic it can be seen that this 4-tuple has a good periodicity because the flows are being assigned the letter a. From time to time the flows have a weaker periodicity (letter A), and sometimes it loses the periodicity for some flows (letters r and t).
In contrast, the 4-tuple 10.0.2.106-195.113.214.215-80-tcp that has the label ‘From-Botnet-V1-TCP-HTTP-Google-Net-Established-1’ was assigned the following chain of states:
71r0rxrurradrrAAarraArudaurrDuradrrDdrraadurrgdruAxrruruDAxrDuarxraaduuadurrrruurdruurrG0rurarruurur0rur0rruuurrrudrurraruadurrudruuaruxurarrruraurururrruAdrrruu0rrrurrraruaarrruraauurrrarrrrrurrurrurrurrrrrrrxuurrurrrrrurruuuurrrrrrruurrrarrauuarrarx0rruruaarruurrrrauAaduuddruaaruuaaaruruarrDrrdruDrraaarrrDddxrrrdaxraDdurrrrururrrurrrrrrrrururDrr(...)
This chain of states represents a typical connection to Google services and is not related with any C&C channel. It can be seen that it does not have a very periodic behaviour (although there are periodic flows from time to time with letters a, A, d and D). Most of the flows are letters r, u and x, which indicates non-periodic flows with variable sizes. There are also many 0s, meaning that the time differences between the flows were more than one hour and therefore the connection timed out.
Another example of a Google connection is the 4-tuple 10.0.2.106-195.113.214.211-80-tcp that was assigned the label ‘From-Botnet-V1-TCP-HTTP-Google-Net-Established-1’ and has the following chain of states:
11r0rrrrrrrrarrrrr0t0rraaaaaa0rraarrrraaaraaa0rrarArraaarrarArrrraaa0rraaarraaarraaarrraaa0rraaarraaarra
aarraaa0rraaarrraaarraaarrrrr0rraaarrraaarraaarraaarraaarrraaarraaarraaa0rraaArrraaarraaarraaa0rraaarraaarraaarraaarraaarraaarraaarraaa0rrrAAArrAaarrAAa0rraaarrrrAar(...)
This chain of states has some periodic flows with letters a and A that can last up to six flows and are separated by moments of non-periodic flows with the letter r. There are also some timeouts of more than one hour (0).
The output of our behavioural model is, then, a chain of states for each analysed behaviour.
This behavioural model may be used for several different purposes, since it is a good representation of the network behaviour. The first usage of this behavioural model was a simple tool to monitor the traffic in real time. The main idea is to read the flows from an Argus source and to process them with our tool called CCDetector [11]. This tool separates the flows into the 4-tuples, assigns each new flow to its corresponding 4-tuple (aggregation) and assigns a letter to it according to the assignment logic of the behavioural model. Then, each 4-tuple can be printed in real time and its behaviour can be monitored.
The advantage of using this monitoring tool is that huge networks with lots of traffic can be analysed in real time, since the packets are first aggregated by Argus into flows and the flows are aggregated again into 4-tuples. When the CCDetector tool works in monitoring mode, it prints the letters of each 4-tuple vertically, to maximize the number of 4-tuples and letters that it can display. Figure 5 shows an example of the tool monitoring the access to the web servers using the TCP port 80 from one university. Figure 5 only represents three minutes of traffic in the network. It can be seen that most of the connections only have one or two flows and therefore are not interesting as targets for further analysis. Only some 4-tuples have a longer behaviour, and of those, few have a periodic behaviour.
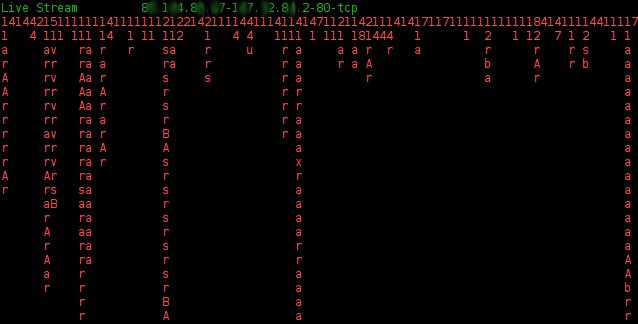
Figure 5: Example of the monitoring tool showing traffic to the web servers of a university.
Another example of the monitoring of flows in real time is shown in Figure 6. This shows all the flows of a botnet during some minutes of operation. The flows correspond mostly to several DNS requests using the TCP protocol. It can be seen that the connections are not so periodic (letter r), with the exception of some flows (letter a). It is interesting that these requests were made with the TCP protocol, which is not common on the Internet since it should be only used for backup of DNS zones between master DNS servers. It is also suspicious that the same host is connecting to almost 30 DNS servers to resolve a domain name. This traffic corresponds to the resolution of a DGA algorithm. Some of the domains being requested are:
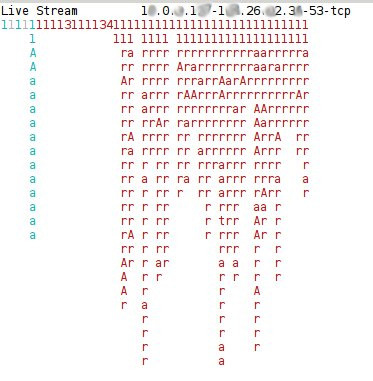 Figure 6: Example of the monitoring tool showing all traffic of a botnet.
This last behaviour can safely be related to the resolution of a DGA algorithm in a TCP DNS server.
Another example of the flows in the HTTP traffic of a botnet is shown in Figure 7. It can be seen that the bot is making a large number of HTTP connections and most of them have a large volume of flows. This may indicate that, unlike normal connections, the hosts contacted by the bots usually use long connections. Figure 7 also shows that most of the flows are not periodic, with some exceptions.
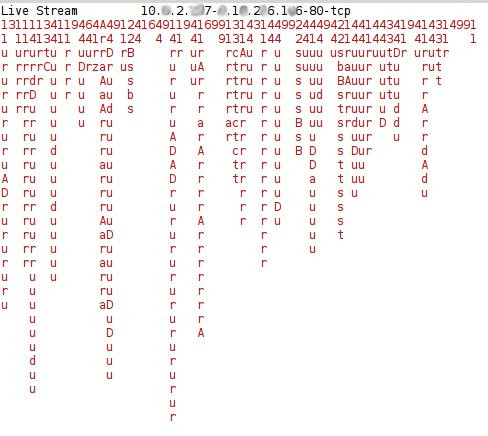 Figure 7: Example of the monitoring tool showing the traffic of the HTTP connections in a botnet.
Another good example of a C&C channel is shown in Figure 8, which shows the HTTP C&C channel of the Zeus botnet.
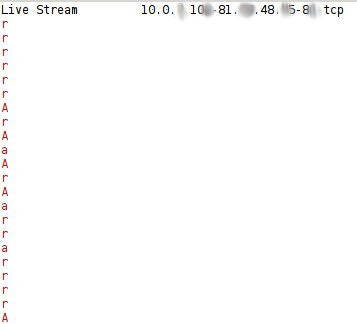
Figure 8: Example of the monitoring tool showing the traffic of the HTTP connections in the Zeus botnet.
It can be seen that the traffic is mostly non-periodic, with some periodic flows. This is because the C&C server was running, but responding with a notification that the connection was forbidden. This is an example of a real C&C channel that is up, but not working. The packets of this connection show the following content:
GET /Zz/config.bin
HTTP/1.1..Accept: */*
Connection: Close
User-Agent: Mozilla/4.0 (compatible;
  MSIE 7.0; Windows NT 6.1; Trident/
  4.0; SLCC2; .NET CLR 2.0.50727;
  .NET CLR 3.5.30729; .NET CLR
  3.0.30729; Media Center PC 6.0)
Host: eyeofgod

HTTP/1.1 403 Forbidden
Date: Fri, 30 May 2014 08:46:20 GMT
Server: Apache
Last-Modified: Tue, 24 May 2011 06:44:15
 GMT
Accept-Ranges: bytes
Content-Length: 2431
Connection: close
Content-Type: text/html
Content-Language: fr
(...)
<title>
This website is temporarily suspended.
</title>
(...)
In these packets it can be seen that the botnet asks for the config.bin file, which is typical of the Zeus bot, and that the response is a 403 Forbidden code. The first connections to this server were successful, receiving a 200 OK response code with the config.bin file. However, after some connections the page was down.
This monitoring tool is useful for visualizing traffic patterns, and can help network administrators to identify interesting connections. However, it is still difficult to recognize manually which connections belong to behaviours that threaten the network. For this purpose we designed the detection method that is described in the next section.
The second part of our proposal is a botnet detection method based on the changes in the states of the C&C channels. Our deep analysis of the traffic helps us to identify how the behaviour of a botnet can be modelled as different states and how the botnet changes from state to state. Each state is defined by the size of the flow, the duration of the flow and the periodicity of the flow and is represented by a letter. In the previously described behavioural model the flows are aggregated into 4-tuples and each 4-tuple is assigned a chain of states (letters). Also, each 4-tuple is assigned a label according to its behaviour. This chain of letters is the output of the behavioural model and the input of the detection method.
Our method operates over this chain of states as a stochastic process with the Markov property, that is, it creates a Markov chain that models and represents the behaviour of the C&C channel. The use of Markov chains is motivated by the transition from one state to another and the probabilities of that transition. A concatenated chain of states is used to generate a Markov chain for the C&C channel, which is then stored on disk as a representation of that behaviour. Apart from the Markov chain, the other important information that is stored for each C&C label in the model is the probability of generating the original chain of states using its own Markov chain. The idea is to use this value later for the detection. Using our dataset, we generated a group of trained models corresponding to botnet behaviours.
The main idea of the detection is to find out if a new chain of states was generated by the Markov chain of an already trained model. This is usually a straightforward computation, calculating the probability of a chain of states of being generated by each stored Markov chain and selecting the higher probability – but there is a shortcoming. It is very likely that the 4-tuple being analysed has some states in the chain that are not part of the Markov chain used for comparison. For example, we may have a Markov chain that was generated with the chain of states ‘23cccffccccfff’ (original chain of states) and we may have a 4-tuple whose chain of states to be tested is ‘11zzzzzzzzyyy’ (testing chain of states). If we compute the probability of the 4-tuple chain being generated by the Markov chain it would be zero. This result is probably correct given how different the chains of states are.
However, it is also true that the traffic from a C&C channel in one botnet is going to be slightly different from the C&C traffic in another botnet. For example, we may have a Markov chain that was generated with the chain of states ‘23cccffccccfff’ (original chain of states) and a testing 4-tuple whose chain of states is ‘23cccffccccffffwswwsswwwwsss’ (testing chain of states). This situation is common on C&C channels that have stopped working (‘wswwsswwwwsss’ letters) after having successfully worked for some time (‘23cccffccccfff’ letters). The probability that this Markov chain generated the testing chain of states is also zero because some transitions are not in the Markov chain. However, it is clear that part of the testing chain of states is very similar to the original chain of states and may have been generated by the same C&C channel.
To solve this issue, we designed a detection method that can compare the chain of states from a 4-tuple with a Markov chain that does not have all of its states. The process can be summarized as follows:
For each testing connection:
Applying this detection approach, we conducted several experiments using our dataset to test the method. The threshold used for the methodology was 0.2. All the captures used are part of the MCFP and can be download for verification. The captures that were used for training are the captures 44, 45, 46, 48, 51, 52, 53 and 54 and the captures used for testing are the captures 42, 43, 47, 49 and 50. The complete pcap files of these captures is more than 700GB and it corresponds to several different botnets. Table 1 shows the characteristics of each of the captures, including which protocol or type of traffic it sends. More details about the size and botnet used on each dataset is shown in Table 2, where it can be seen that some captures included the use of more than one bot at the same time.
| Id | IRC | SPAM | CF | PS | DDoS | P2P | US | HTTP | Note |
| 1 | Y | Y | Y | ||||||
| 2 | Y | Y | Y | ||||||
| 3 | Y | Y | Y | ||||||
| 4 | Y | Y | Y | UDP and ICMP DDoS. | |||||
| 5 | Y | Y | Y | Scan web proxies. | |||||
| 6 | Y | Proprietary C&C. RDP. | |||||||
| 7 | Y | Chinese hosts. | |||||||
| 8 | Y | Proprietary C&C. Net-BIOS, STUN | |||||||
| 9 | Y | Y | Y | Y | |||||
| 10 | Y | Y | Y | UDP DDoS. | |||||
| 11 | Y | Y | Y | ICMP DDoS. | |||||
| 12 | Y | Synchronization. | |||||||
| 13 | Y | Y | Y | Captcha. Web mail. |
Table 1: Characteristics of the botnet captures. (CF: ClickFraud, PS: Port Scan, US: Compiled and controlled by us.)
| Id | Dur | # Packets | # NetFlows | Size | Bot | # Bots |
| 1 | 6.15 | 71,971,482 | 2,824,637 | 52GB | Neris | 1 |
| 2 | 4.21 | 71,851,300 | 1,808,123 | 60GB | Neris | 1 |
| 3 | 66.85 | 167,730,395 | 4,710,639 | 121GB | Rbot | 1 |
| 4 | 4.21 | 62,089,135 | 1,121,077 | 53GB | Rbot | 1 |
| 5 | 11.63 | 4,481,167 | 129,833 | 37.6GB | Virut | 1 |
| 6 | 2.18 | 38,764,357 | 558,920 | 30GB | Menti | 1 |
| 7 | 0.38 | 7,467,139 | 114,078 | 5.8GB | Sogou | 1 |
| 8 | 19.5 | 155,207,799 | 2,954,231 | 123GB | Murlo | 1 |
| 9 | 5.18 | 115,415,321 | 2,753,885 | 94GB | Neris | 10 |
| 10 | 4.75 | 90,389,782 | 1,309,792 | 73GB | Rbot | 10 |
| 11 | 0.26 | 6,337,202 | 107,252 | 5.2GB | Rbot | 3 |
| 12 | 1.21 | 13,212,268 | 325,472 | 8.3GB | NSIS.ay | 3 |
| 13 | 16.36 | 50,888,256 | 1,925,150 | 34GB | Virut | 1 |
Table 2: Amount of data on each botnet capture. Duration is in hours.
The results obtained by our method, using a threshold of 0.2, are shown in Table 3. Table 3 shows that it was possible to obtain an F-Measure value (FM1 in the table) of more than 90% (0.93 in the table) in two experiments and of 50% (0.50 in the table) in another. It also shows that in the experiment with Id 47 there were no TPs and therefore no botnet was detected, but there were no FPs either, meaning that there were no false alarms. This means that the threshold for this experiment was too low and a better threshold should be used. We ran all the experiments with the same threshold because it was trained, but a threshold of more than 3.8 in experiment 47 achieves an FM1 of 0.72. Experiment 49 is the only experiment where there were no TP detections and there were FPs. This usually means that the trained behavioural models may not be the best for this type of botnet. A deeper analysis showed that the C&C channel in experiment 49 had a chain of states similar to 33CcccccccccccccCCcCttttccccttcttcccccccccccccccccccccCCcttcctccccccccccccccccccc ccccccccccccccctt
ttcc(...) and there were no C&C channels in the training model with this pattern. This suggests that if we have the appropriate model for the behaviour, we should be able to detect it properly.
| Id | TP | TN | FP | FN | TPR | TNR | FPR | FNR | Prec | Acc | ErrR | FM1 |
| 42 | 95.6 | 251.5 | 14.0 | 0 | 1 | 0.94 | 0.05 | 0 | 0.87 | 0.96 | 0.03 | 0.93 |
| 43 | 63.1 | 99.7 | 2 | 8.4 | 0.88 | 0.98 | 0.02 | 0.11 | 0.96 | 0.93 | 0.06 | 0.92 |
| 47 | 0 | 84 | 0 | 46.7 | 0 | 1 | 0 | 1 | -1 | 0.64 | 0.3 | 0 |
| 49 | 0 | 674.8 | 30.5 | 306.2 | 0 | 0.95 | 0.04 | 1 | 0 | 0.66 | 0.33 | -1 |
| 50 | 173.6 | 195 | 64.5 | 274.4 | 0.38 | 0.75 | 0.24 | 0.61 | 0.72 | 0.52 | 0.47 | 0.50 |
Table 3: Results obtained in the five real testing experiments.
The idea of showing all the testing experiments, regardless of good or bad metrics, was to show that it is important to be clear in the description and the output of the results so that others can evaluate and compare [12] their techniques [13]. We consider these as good results and further new models can greatly improve them.
A deep analysis of several botnet and normal captures led us to design a behavioural model of network traffic. This model of behaviours in the network is very simple, only considering three features per flow: the size, the duration and the periodicity. With these features it was possible to assign a state to each flow. The states were represented with letters to visualize and verify the traffic manually. The chain of states that is generated for each connection then can be monitored, visualized and analysed.
The first application of this behavioural model was a monitoring program that allowed us to identify the differences between botnet and normal connections. The differences are very visible, which led us to design a botnet detection method using this behavioural model.
The detection method, using Markov chains, is an idea that can greatly improve the botnet detection area. We verified the method using 13 different real, labelled and public datasets that we captured in our Malware Capture Facility Project. The method obtained an F-Measure up to 93% in the best experiments.
There are many possible usages of the behavioural model. We proposed a monitoring tool that can print the behavioural pattern in real time, and a detection method that can detect new and unseen botnets. Our future work will be to develop a behavioural firewall that can take advantage of these models and block the corresponding behaviours in the network.
[1] Garcia, S.; Uhlir, V.; Rehak, M. Identifying and Modeling Botnet C&C Behaviours. Proceedings of the 1st International Workshop on Agents and CyberSecurity (ACySE ’14), New York, 2014. ACM.
[2] Seewald, A. K.; Gansterer, W. N. On the detection and identification of botnets. Computers & Security, 29(1):45–58, 2010.
[3] Wurzinger, P.; Bilge, L.; Holz, T.; Goebel, J.; Kruegel, C.; Kirda, E. Automatically generating models for botnet detection, pp.232–249. Springer, Berlin, 2010.
[4] Garcia, S. Malware Capture Facility Project, 2013. http://mcfp.felk.cvut.cz.
[5] Manasrah, A. M.; Hasan, A. Detecting Botnet Activities Based on Abnormal DNS traffic. Journal of Computer Science, 6(1):97–104, 2009.
[6] Strayer, W. T.; Walsh, R.; Livadas, C.; Lapsley, D. Detecting botnets with tight command and control. In Proceedings of the 31st IEEE Conference on Local Computer Networks, pp.195–202, 2006.
[7] Chang, S.; Daniels, T. E. P2P botnet detection using behaviour clustering & statistical tests. Proceedings of the 2nd ACM workshop on Security and artificial intelligence, pp.23–30, New York, New York, USA, 2009. ACM.
[8] Lu, W.; Ghorbani, A. A. Bots Behaviours vs . Human Behaviours on Large-Scale Communication Networks ( Extended Abstract ), pp.415–416, 2008.
[9] Rieck, K.; Trinius, P.; Willems, C.; Holz, T. Automatic Analysis of Malware Behaviour using Machine Learning. Journal of Computer Security, 19(4):639–668, 2011.
[10] QoSient. Argus, Network Audit Record Generation and Utilization System. http://www.qosient.com/argus/index.shtml, 2012.
[11] Garcia, S. Botnet Detectors Comparer, 2014.
[12] Garcia, S.; Grill, M.; Stiborek, J.; Zunino, A. An Empirical Comparison of Botnet Detection Methods. Computers & Security, 45(0):100 – 123, 2014.
[13] Rossow, C.; Dietrich, C. J.; Grier, C.; Kreibich, C.; Paxson, V.; Pohlmann, N.; Bos, H.; Van Steen, M. Prudent Practices for Designing Malware Experiments: Status Quo and Outlook. 2012 IEEE Symposium on Security and Privacy, pp.65–79, May 2012.
![]()