Trend Micro, China
As we all know, Apple’s iOS and MacOS systems have gained much popularity with the huge success of the iPhone and the MacPro. System security vulnerabilities in iOS and MacOS have been developed and abused by hackers, and have also begun to attract more attention from security researchers.
The more you know about your enemy, the easier it is to defeat him. But how? Since iOS 10, Apple has released the unpacked/decrypted kernel cache (*.ipsw), but the system source code, in particular the kernel and driver part, remain close-sourced. What is more, symbol info in the binary (kernel cache) has been greatly removed, which makes reverse engineering more difficult.
A challenge means a chance. The truth in security research is that the more attack interface you expose, and the more implementation you do, the greater the probability of finding a zero-day vulnerability. The relatively good news is that, in every iOS/MacOS system update or new hardware release (e.g. the touch bar in MacPro), there is always a lot of change in interface and implementation code (e.g. more selectors exposed in the driver service via IOUserClient).
Hence, we plan to expose the typical workflow and thinking in order to explore and analyse the new (kernel) attack interface using reverse engineering and dynamic analysis. We will not only share the relative tool chain used to explore the attack interfaces but also the public kernel vulnerability finding system that is based on enhanced passive fuzzing. Finally, we will describe some of the vulnerabilities we have found using these methodologies.
The basic work flow can be separated into the three parts where the architecture or implementation of the iOS/OSX system kernel has potentially changed: identification of attack interfaces using reverse analysis (static analysis), use of dynamic analysis for the kernel attack interface, and use of a passive kernel fuzzing system, accordingly.
Typically, the occurrence of a change in kernel code would coincide with an iOS/OSX version being released following a public security bulletin(s), Apple adding new hardware equipment (e.g. touch bar equipment for MacOS, A12 CPU update for iPhone, new graphic I/O devices, etc.), and so on.
After obtaining the whole kernel cache binary, the first step would normally be to identify the modification or new attack interface using reverse engineering. Since we focus on the kernel part in this paper, we should disassemble the Mach-O code in order to identify the driver extension module, classes, external methods, metadata, user clients, system call and other data structures for the kernel attack interface. Moreover, after a XUN and kexts diff and call graphic analysis, the entries list vector for those updated functions, which is used in the following steps, can be obtained quickly and exactly.
As part of our research, we would like to know not only the module/API information but also the context at runtime when these APIs are called. As the second step of the whole work flow, typically, dynamic analysis would try to get the call stack (with function name symbol and argument value) both in user mode and kernel mode, and determine how an object related to the kernel API is created (e.g. how the service is opened for IoConnectCallMethod), and so on.
Finally, as the third step, we would carry out (passive) fuzzing of these kernel attack interfaces to hunt for zero-day vulnerabilities. The key to fuzzing system design is to touch as many possible execution paths (or as much code coverage) as possible, and catch the first spot where a vulnerability is triggered. Hence, we try to hook the attack interface in the kernel and fuzz the data passed through from user mode directly to try to ‘touch’ more execution paths after the restriction check. A kernel address sanitizer mechanism is also introduced in order to catch the point of heap/stack overflow, for example.
As we can see, the static analysis would identify a new attack interface and dynamic analysis would help to trigger it, while the fuzzing system used on the identified attack interface would hunt for new vulnerabilities (kernel panic/crash) to help find more new attack interfaces.
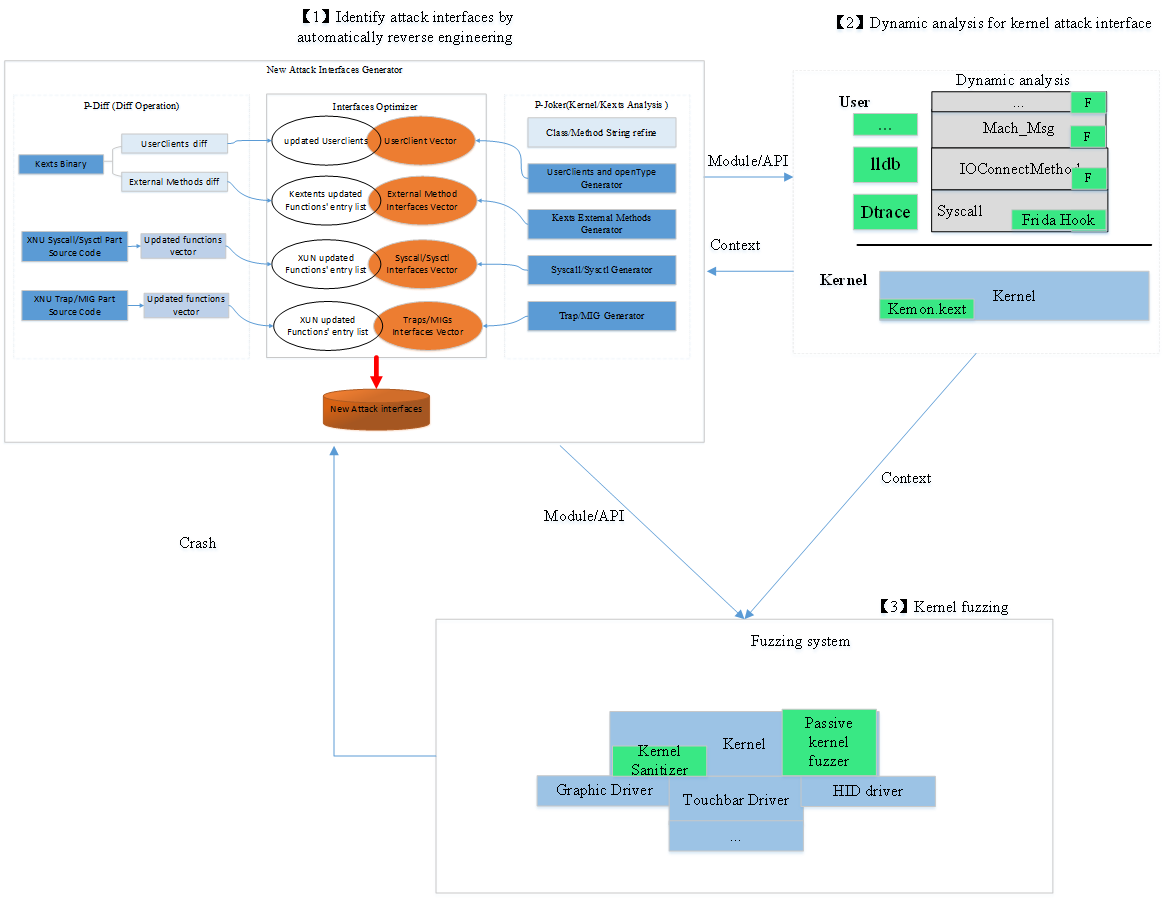 Figure 1: Basic architecture of the solution.
Figure 2 show the reverse engineering solution for analysis of a macOS/iOS system. The new attack interfaces generator consists mainly of three parts, the work flow of which can be summarized in the following steps:
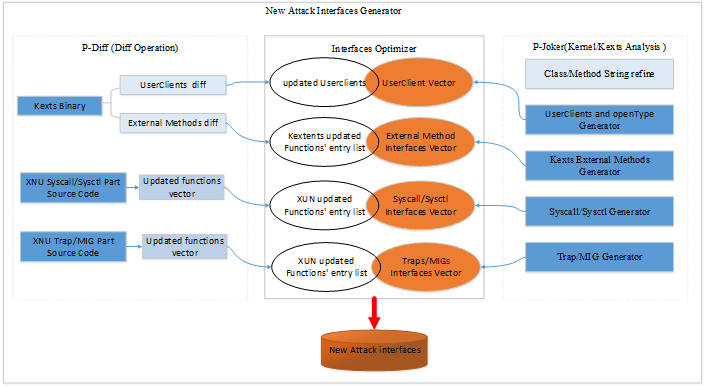
Figure 2: The reverse engineering solution for kernel and kextentions.
For the iOS or macOS kernel and kexts analysis, there are already many open-source tools available in GitHub, as shown in Table 1, but there are still some features that are not available for automatic analysis of the kernel or each kext. We introduce p-joker, which is an automatic tool used to analyse the macOS and iOS core module, the most powerful function of which is to get the service connection types and corresponding UserClients’ external dispatch methods automatically.
| Tools | Symbolicate C++ method tables | Class hierarchy | Struct class | UserClients and open type | Dispatch method |
| iokit-utils | N | Y | N | Y (using IOServiceOpen) | N |
| ida_kernelcache | Y | Y | Y | N | N |
| ioskextdump | Y | Y | N | N | Y(part) |
| Ryuk | Y | N | Y | N | N |
| p-joker | Y | Y | Y | Y | Y |
Table 1: Comparison of open-source tools.
For the XUN project and kexts implementation diff, we introduce an IDA Pro script, p-diff, which can diff those non-open-source kexts and get a list of changed functions automatically. Then, it analyses the related kext and gets the call graphic for each updated function, and their entry list can be surmised from these calling sequences. In the end, p-diff will reserve those interfaces that can be accessed within a sandbox or by some user-mode privilege process.
Figure 3 is an overview of p-joker implementation. Later, we will introduce how to get the service connection type and how to get the dispatch method. As mentioned before, there are many open‑source tools available, so we will simply introduce those with overlapped content.
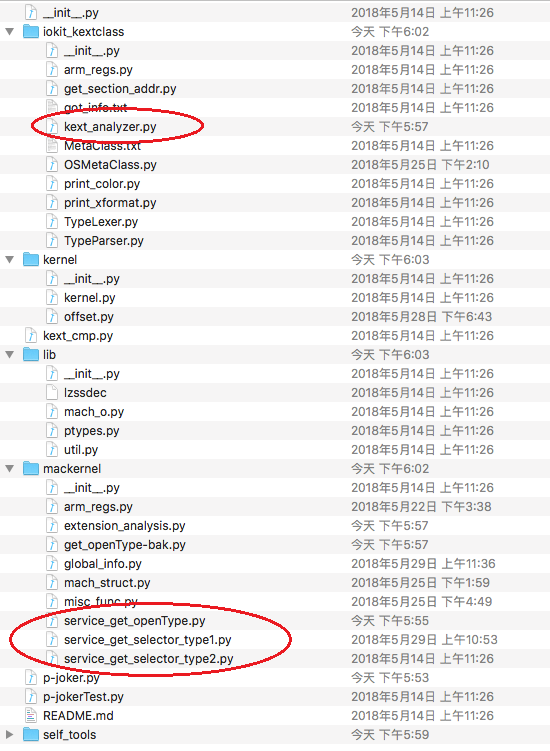 Figure 3: Overview of the implementation of p-joker.
The string symbol was stripped from the release version of the system so, for macOS, we can analyse the kernel and driver contained in the Kernel Debug Kit instead of the release one. However, there are no debug kits available for iOS. So we should refine the method names for each OSObject class, including the instance method table and meta method table. We know all the Apple drivers are implemented in C++, all of the services are inherited from the IOService class. So, through the inherited mechanism, many method names can be inferred from their parent class. Figure 4 shows the IOMobileFramebuffer class and the method table of its parent classes.
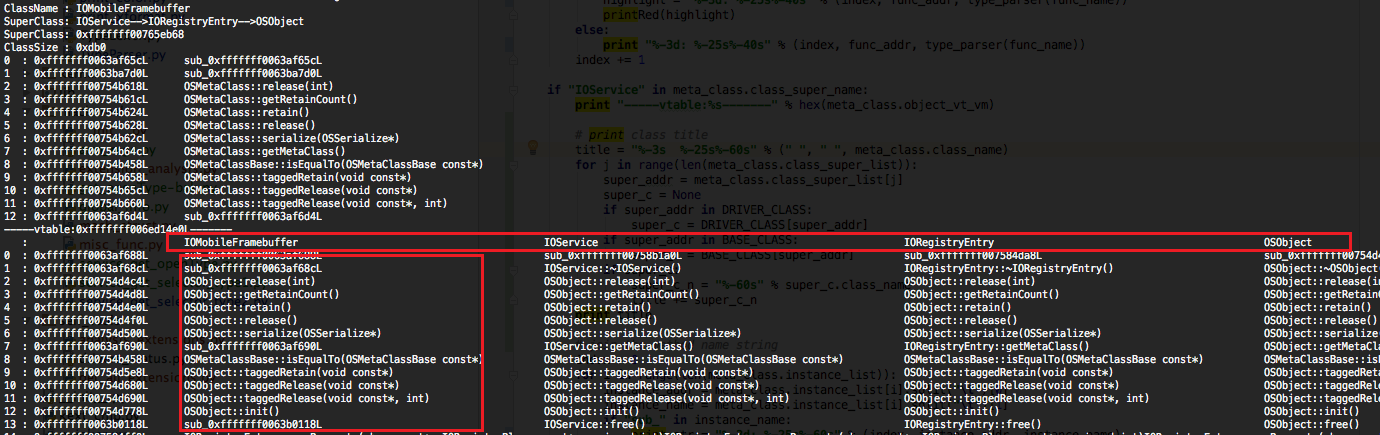 Figure 4: Refining the method table for the IOMobileFramebuffer class.
The IOKit in the kernel part delivers many MIG interfaces to user space in order to operate different drivers. When one user client is spawned, it should open the corresponding service first. In the user space, the IOServiceOpen function is responsible for spawning the driver’s proxy client according to the given properties dictionary. Figure 5 shows the process to open a service through a MIG interface.
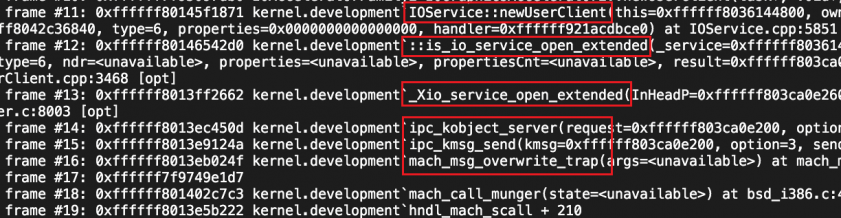
Figure 5: Call graphic of process to open a service in user space.
During the process to open a service, the system will first call the parent newUserClient method. However, because the IOService class is an abstract class and most of its functions are virtual ones, it will call the subservice that implements it. Figure 6 is an example of spawning an IOFramebuffer user client with connection type 0.
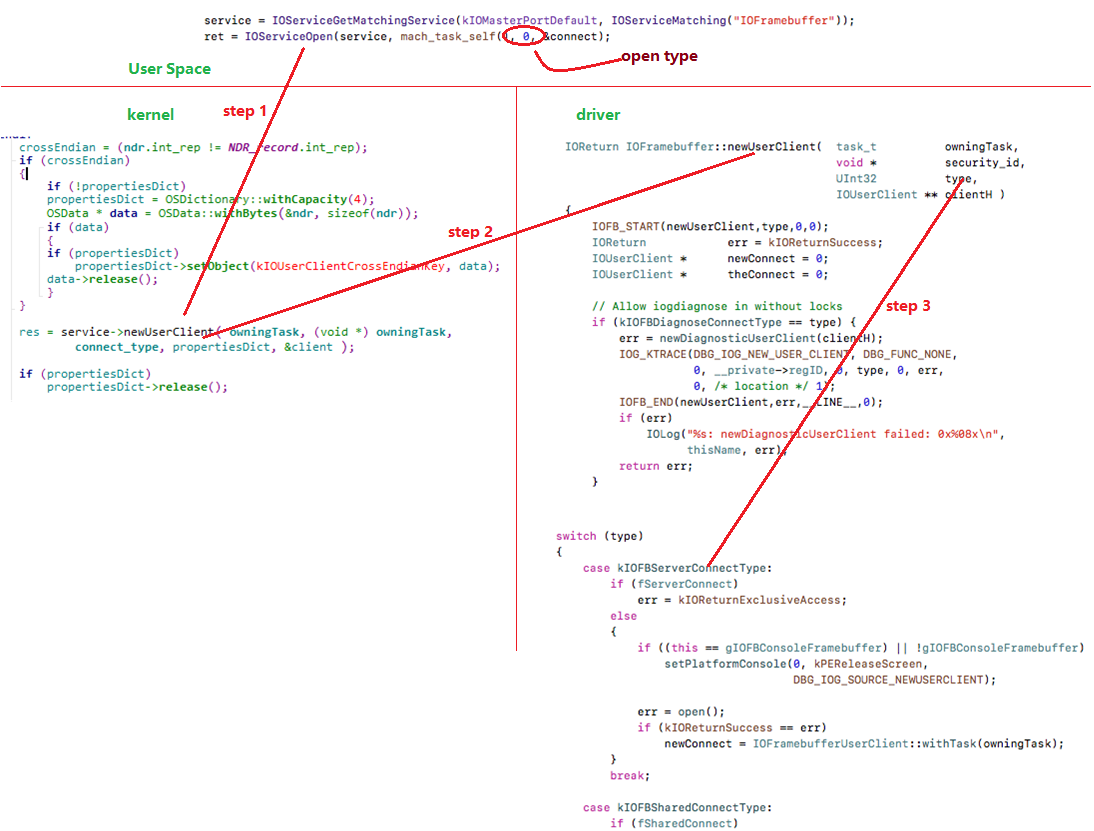
Figure 6: Spawning an IOFramebuffer user client with connection type 1.
So, the steps to find the connection tuple as shown in Figure 6 are the following:
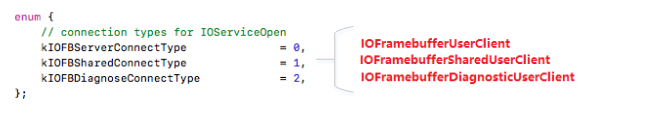
Figure 7: Connection types for IOServiceOpen.
IOUserClient is a subclass of IOService, which provides a basis for communication between client applications and I/O kit objects. Figure 8 shows the process of executing an external method.
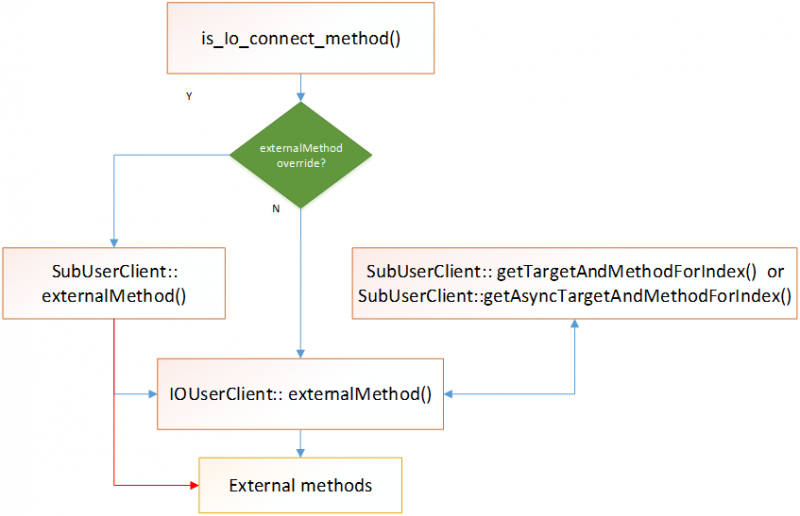 Figure 8: ‘ExternalMethod’ function workflow.
Clients use the ‘IOUserClient::externalMethod’ function to execute external methods. All the external methods are implemented within drivers and can be indexed by selectors. Drivers also define the methods’ input and output conditions, which are used to check the user-mode input or output in coarse-grained user-mode input. For researchers, it is important to find the corresponding selector and conditions for these external methods.
Generally, subservices will define this information in the externalMethod override function as a dispatch table that is usually a static constant array. If subservices do not override the externalMethod function, it will be defined in the getTargetAndMethodForIndex function or the getAsyncTargetAndMethodForIndex function, and the dispatch structure will be a little different, as shown in Figure 9.
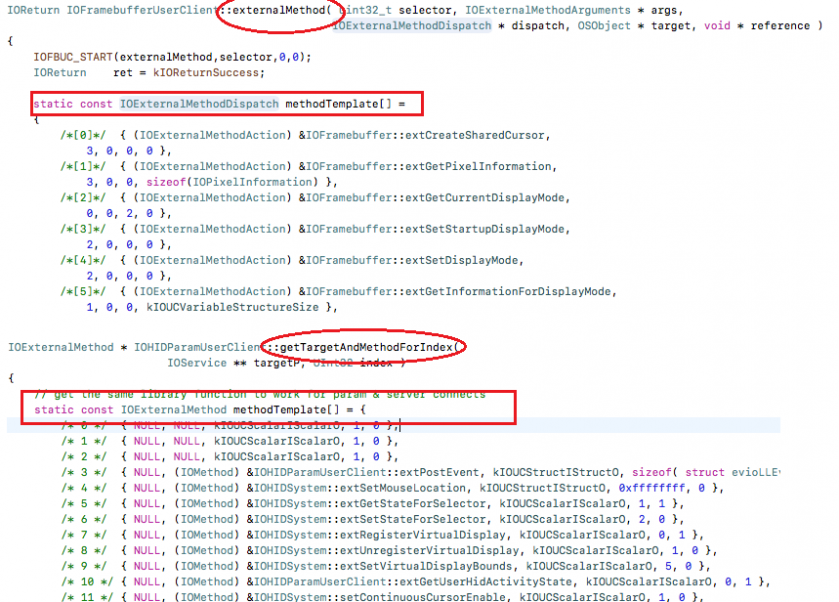
Figure 9: Defined as local constant array in functions.
But there are also many SubUserClients declared as global arrays, as shown in Figure 10.
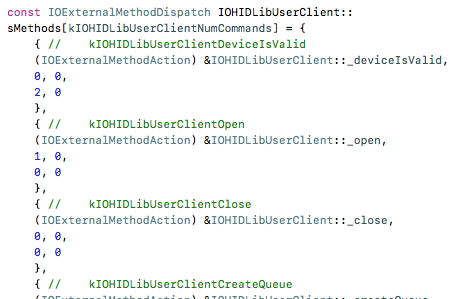 Figure 10: Defined as global constant array in classes.
Regardless of whether the dispatch table is defined as a local array or a global array, the methodology to find the array is as follows:
Some drivers implement the external dispatch method using code logic instead of a constant array, as shown in Figure 11. Therefore, the methodology to find this kind of dispatch is as follows:
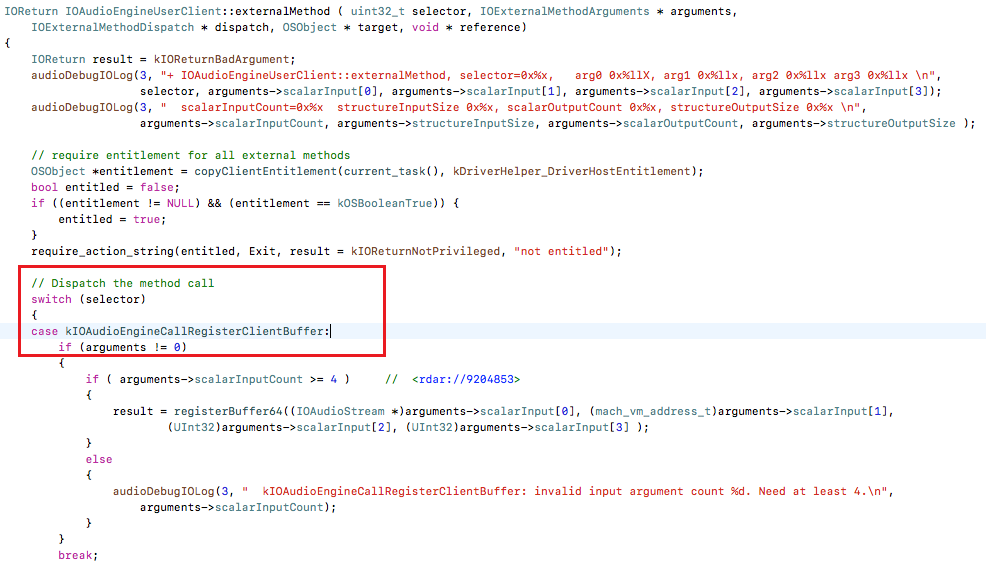
Figure 11: Defined in switch case.
Depending on the methodology introduced previously, p-joker typically contains two implementation technologies. One emulates the execution of assembly instructions in order to get connection types and external methods implemented by code logic, while the other parses the symbol table in the driver Mach-O file in order to get the dispatch table defined as a constant array.
a. Start from scratch
To analyse or emulate all instructions from scratch is hard, however, the functions we care about use only a small instruction set. Figure 12 shows the assembly of the override newUserClient function.
To improve the accuracy, the key point is to ensure the correctness of emulation for control flow and data flow. For control flow, as many instructions as possible should be emulated. For data flow, the integrity and accuracy of registers’ data transfer should be ensured. From Listing 1, it can be seen that connection type is the fourth argument, so during the instruction analysis process, it’s important to analyse the control flow depending on ecx/rcx and related registers.
AppleHDAEngine::newUserClient(AppleHDAEngine *this, task *a2, void *a3, int a4, IOUserClient **a5)
Listing 1: The AppleHDAEngine::newUserClient function.
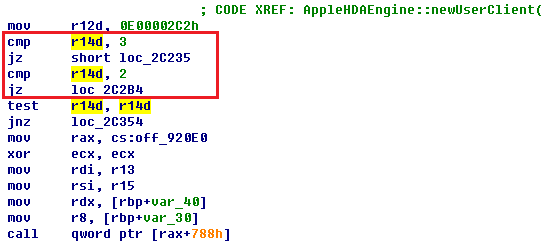
Figure 12: Assembly of AppleHDAEngine::newUserClient function.
b. Angr or miasm
As an alternative to starting from scratch, there are some excellent binary analysis tools, such as angr [1] and miasm [2], both of which can emulate the x64 or ARM code. Take miasm for example: not only can it emulate the execution of assembly instructions but it also monitors the value in each register.
Figure 13 shows the control flow that can be obtained using the miasm tool, after which the corresponding block can be parsed, with the result shown in Figure 14.
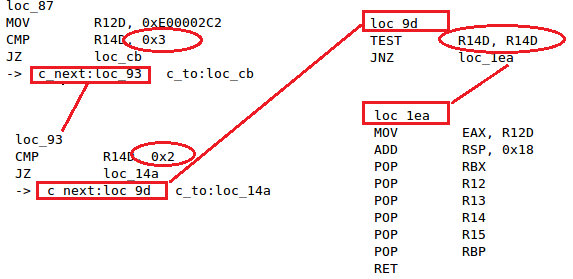
Figure 13: Control flow of the AppleHDAEngine::newUserClient function obtained using miasm.
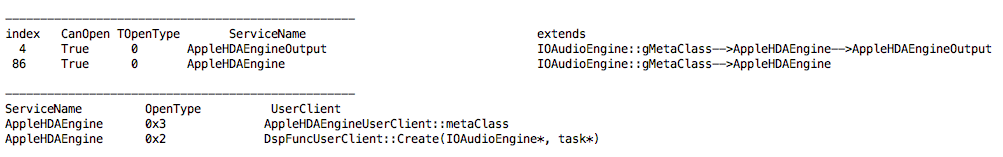
Figure 14: User clients and connection types in the AppleHDA driver.
As we know, the constant variables are saved in the symbol table. So, it’s very convenient to parse this table to get the address for each constant array.
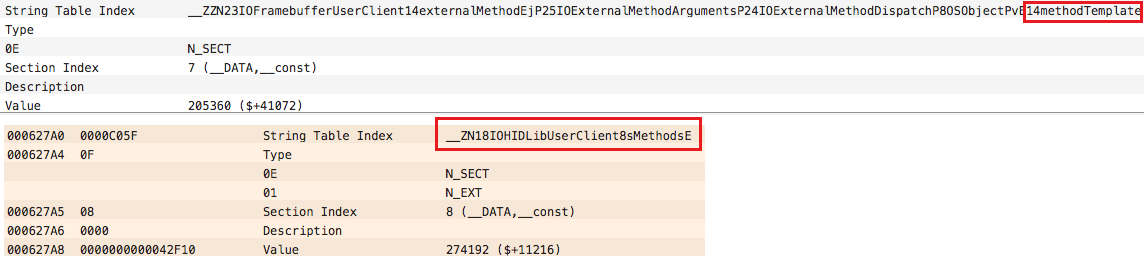
Figure 15: Constant variables in the symbol table.
After getting the address, the binary contents can simply be parsed with the IOExternalMethodDispatch or IOExternalMethod structure. The results are shown in Figure 16.
In the end, all the user clients with their connection types and external method dispatches can be obtained through these steps, and saved as interface vectors.
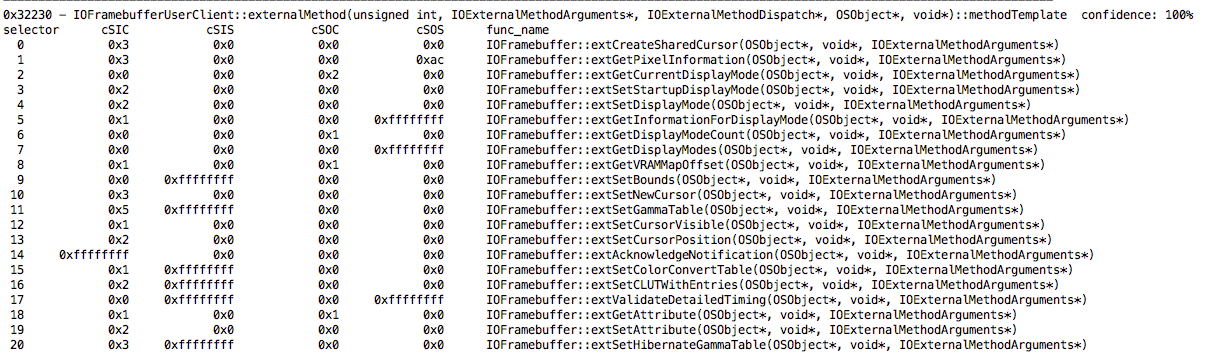
Figure 16: External method dispatch of IOFramebufferUserClient.
Figure 17 shows the implementation of the mov, cmp, je, jz and test instructions operation. P-joker implements an API set to operate the register. For emulating more operations, the x64 or ARM architecture reference manual [3] can be referenced.
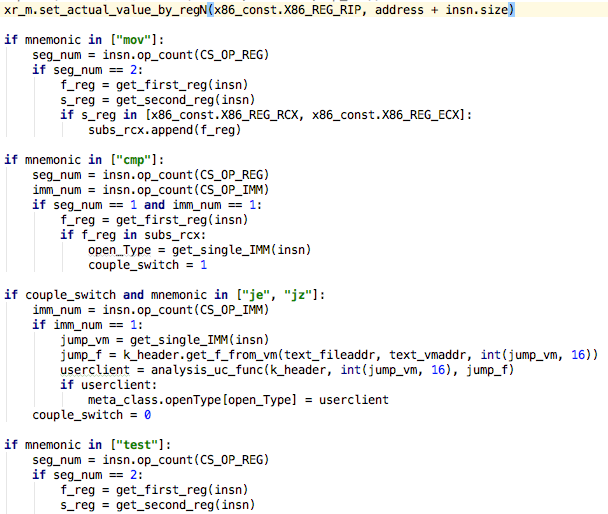 Figure 17: Code snippet for emulating instruction execution from scratch.
Figure 18 shows the implementation used to read contents from a Mach-O binary using the IOExternalMethodDispatch or IOExternal structure.
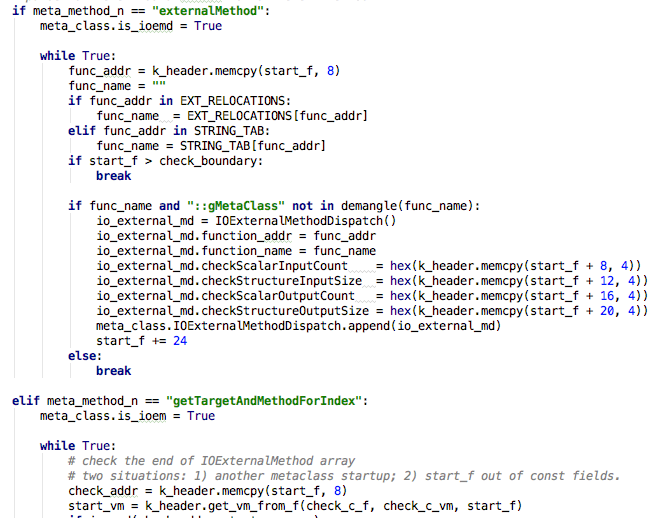 Figure 18: Parsing the binary contents using the corresponding structure.
Apple has open-sourced its XNU project for both macOS and iOS systems, as well as part of the drivers. For closed-source drivers, automatic reverse engineering methods have already been introduced, therefore all the attack interfaces can be obtained.
However, in order to find the newest introduced attack interface, researchers need to know which functions have been updated and which services or syscalls are newly added. Once that information has been obtained they also need to know how to access or call these updated or newly added attack interfaces. The following sections will introduce how to find the newly added attack interfaces and list their entry points.
MIG interface, syscall, sysctl and traps are implemented in the system kernel. Listing 2 shows their source code in the XNU project.
xnu-4570.71.2/
|-- bsd
|   `-- kern
|       |-- kern_sysctl.c                //sysctl
|       `-- syscalls.master              //syscall
`-- osfmk
    |-- device
    |   `-- device.defs                 //mig
    |-- kern
    |   `-- syscall_sw.c                //traps
    `-- mach
        `-- mach_traps.h               //traps
Listing 2: Related implementation files in XNU source code.
1. First, coarse-grained parse and diff these files in order to get the new interfaces. These interfaces include the newly added ones and ones in which arguments have changed. Alternatively, the corresponding information can be obtained directly from the kernel binary diff – there are already many excellent tools available, such as joker [4].
2. Next, diff all the files in the XNU project and tag those that have been changed or newly added. Ignore unrelated files, such as test code files and deleted files, take BSD VFS.
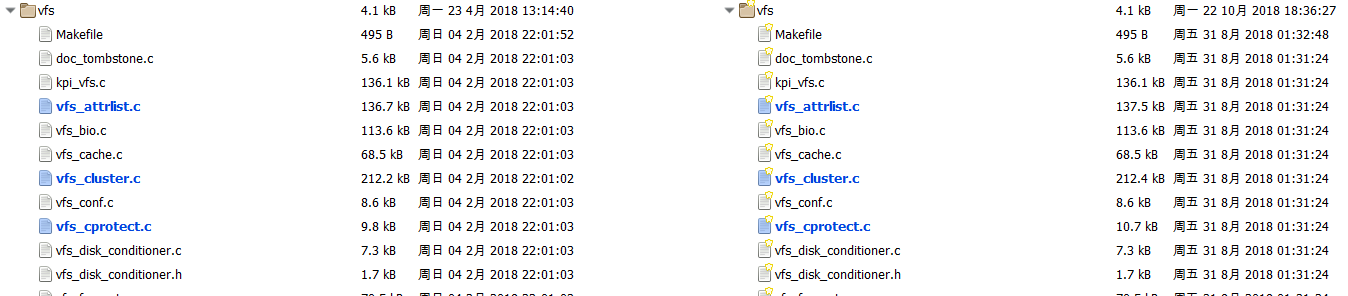
Figure 19: Difference between the BSD VFS folders.
3. Next, compile statistics for changed or newly added functions in those files, and the related function name list.
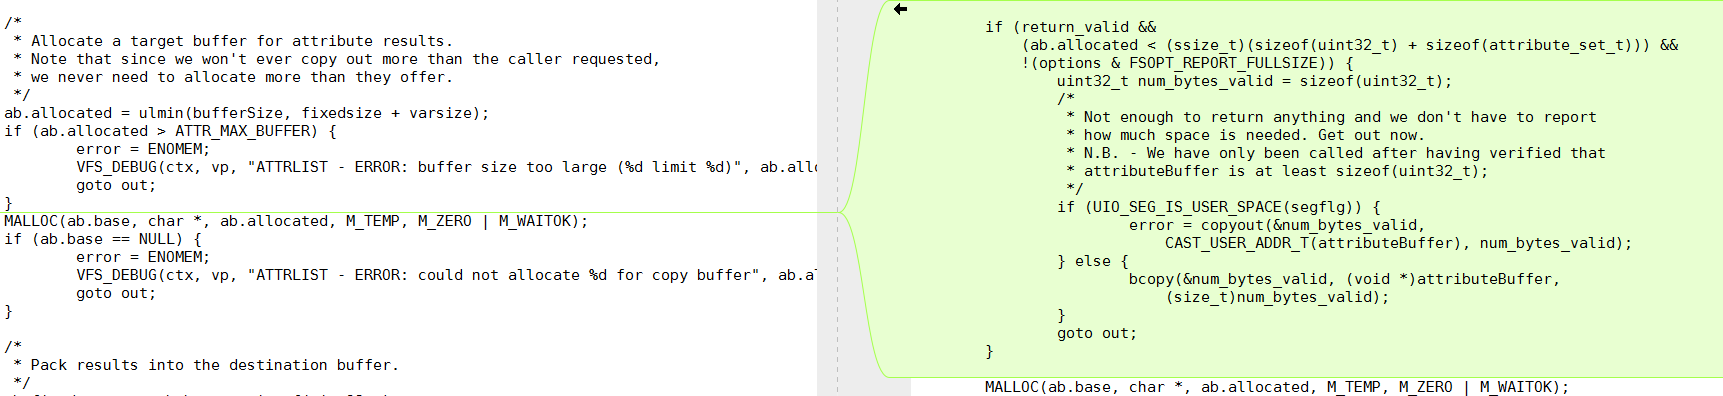 Figure 20: Changed function ‘getvolattrlist ()’ in the vfs_attrlist.c file.
4. Next, construct the calling sequence for the changed functions and get the entry functions. This step in p-diff is implemented through an IDA Pro script. There are two functions, ‘CodeRefsTo(ea, flow)’ and ‘CodeRefsFrom(ea, flow)’, available in the idautils.py file [5].

Figure 21: Calling sequence of the ‘getvolattrlist ()’ function.
5. Finally, list the entry functions for each calling sequence, and check if they are interfaces that are exposed to user mode. Table 2 shows the syscalls that can be called from user space. Together with the newly added and changed interfaces, these are the new attack interfaces which should be the main fuzz point.
| 220 AUE_GETATTRLIST ALL { int getattrlist(const char *path, struct attrlist *alist, void *attributeBuffer, size_t bufferSize, u_long options) NO_SYSCALL_STUB; } |
| 461 AUE_GETATTRLISTBULK ALL { int getattrlistbulk(int dirfd, struct attrlist *alist, void *attributeBuffer, size_t bufferSize, uint64_t options); } |
| 228 AUE_FGETATTRLIST ALL { int fgetattrlist(int fd, struct attrlist *alist, void *attributeBuffer, size_t bufferSize, u_long options); } |
| 476 AUE_GETATTRLISTAT ALL { int getattrlistat(int fd, const char *path, struct attrlist *alist, void *attributeBuffer, size_t bufferSize, u_long options); } |
Table 2: Syscalls obtained from the calling sequence in the fourth step.
In fact, the example we mentioned is the patch for CVE-2018-4243, which was found by Ian Beer. However, using this methodology, researchers can find the newest attack interface quickly. After that, they can update their fuzz corpus accordingly and discover the potential vulnerabilities introduced by the newly added code.
Nearly all the drivers on macOS are closed source, however, the methodology is similar. The only difference is that all the diff operations would be based on binary instead of source code. For binary diff, an IDA Pro script can be used with the BinDiff [6] plug-in.
All drivers on macOS can be found in the ‘/System/Library/Extensions’ folder. A comparison of the same driver’s binary can be made for different versions. But for iOS, all the drivers are pre-compiled within the kernelcache file. Researchers should split all drivers first using p-joker or an existing tool such as joker. However, the format for iOS kernelcache has changed, leading to the existing tools no longer working. Luckily, p-joker supports the new format – we will push the newest p-joker version to GitHub soon.
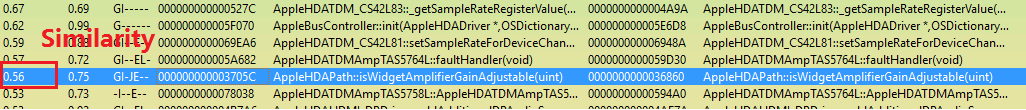
Figure 22: Diff results using an IDA Pro script.
The main purpose of driver diff is to find selectors for the newly added external methods and the external method entries for changed functions. This way, we only get those interfaces that can fuzz the updated code effectively and in a timely way.
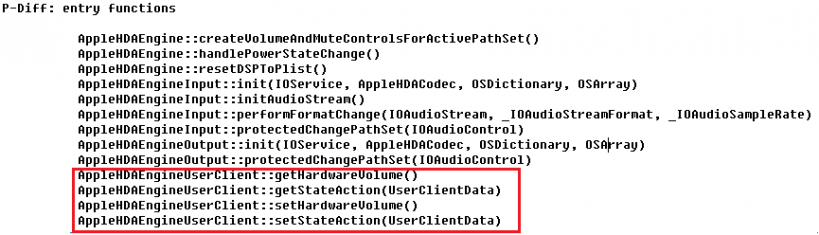
Figure 23: Find the entry functions list using p-diff.
After the calling sequences have been obtained, the main job is to find the user-mode entry that can call them. Figure 24 shows a code snippet of p-diff implementation.
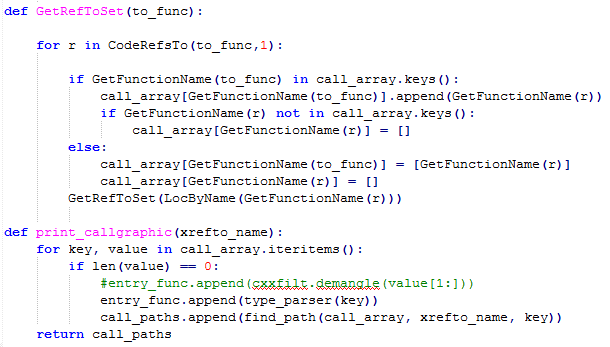
Figure 24: Code snippet of p-diff implementation.
Some kextensions will have been removed or added in the newest version release. Table 3 shows the updated kernel extensions list.
| Drivers | Status |
| com.apple.driver.ApplePinotLCD | Newly added |
| com.apple.AppleARM64ErrorHandler | Newly added |
| com.apple.drivers.AppleS7002SPU | Newly added |
| com.apple.driver.AppleSMCWirelessCharger | Newly added |
| com.apple.driver.usb.AppleUSBHub | Newly added |
| com.apple.AppleSMC_Embedded | Changed |
| com.apple.AGXFirmwareKextG10P | Changed |
| com.apple.kext.CoreTrust | Newly added |
| com.apple.nke.lttp | Newly added |
| com.apple.iokit.IOUSBHostFamily | Changed |
| com.apple.driver.BCMWLANFirmware4357_Hashstore | Changed |
| com.apple.Libm.kext | Changed |
| com.company.driver.modulename | Newly added |
| com.apple.AppleHapticsSupportCallan | Newly added |
| com.apple.driver.AppleCredentialManager | Newly added |
| com.apple.security.AppleImage4 | Newly added |
| com.apple.AGXFirmwareKextG5P | Changed |
| com.apple.file-systems.hfs.kext | Changed |
| com.apple.driver.AppleAVE | Changed |
| com.apple.iokit.IOReporting | Newly added |
| com.apple.driver.AppleEmbeddedAudioLibs | Newly added |
| com.apple.driver.AOPTouchKext | Newly added |
| com.apple.drivers.AppleS7002SPUSphere | Newly added |
Table 3: Updated kextensions in iOS 12.0.1.
Due to there being lots of drivers, here we only take the AppleHDA.kext driver as an example. Table 4 shows its external method dispatch details. Table 5 shows the updated functions from macOS 10.13.6 to macOS 10.14, as well as their entry interfaces in user-mode.
| Selector | Function name | Scalar InputCount | Structure InputSize | Scalar OutputCount | Structure OutputSize |
| 0 | getState | 2 | 0 | 0 | 0xfff |
| 1 | setState | 2 | 0xfff | 0 | 0 |
| 2 | resetDSPToPropertyList | 0 | 0 | 0 | 0 |
| 3 | isPortPresent | 1 | 0 | 1 | 0 |
| 4 | getHardwareVolume | 0 | 0 | 6 | 0 |
| 5 | setHardwareVolume | 1 | 0 | 0 | 0 |
| 6 | getActiveSpatialChannels | 0 | 0 | 0x10 | 0 |
| 7 | getAudioSnoopEnabled | 0 | 0 | 3 | 0 |
| 8 | setAudioSnoopEnabled | 3 | 0 | 0 | 0 |
| 9 | setSpatialChannelMute | 2 | 0 | 0 | 0 |
Table 4: External method dispatch details for AppleHDA.kext in macOS 10.14.
| P-Diff: entry functions for function AppleHDAEngine::resetVolumeFromVolumeCacheForAppleHDAPathSet(AppleHDAPathSet) AppleHDAEngineUserClient::setStateAction(UserClientData) |
| P-Diff: entry functions for function AppleHDAEngine::resetSoftwareVolumeFromVolumeCacheForAppleHDAPathSet( AppleHDAPathSet) AppleHDAEngineUserClient::setStateAction(UserClientData) |
| P-Diff: entry functions for function AppleHDAPath::isWidgetAmplifierMuteCapable() AppleHDAEngineUserClient::setSpatialChannelMute() AppleHDAEngineUserClient::setStateAction(UserClientData) |
| P-Diff: entry functions for function AppleHDAPath::isWidgetAmplifierGainAdjustable() AppleHDAEngineUserClient::getHardwareVolume() AppleHDAEngineUserClient::getStateAction(UserClientData) AppleHDAEngineUserClient::setHardwareVolume() AppleHDAEngineUserClient::setStateAction(UserClientData) |
| P-Diff: entry functions for function AppleHDAPath::getWidgetAmplifierGainRange() AppleHDAEngineUserClient::getHardwareVolume() AppleHDAEngineUserClient::getStateAction(UserClientData) |
| P-Diff: entry functions for function AppleHDAPathSet::isAmplifierGainAdjustable() AppleHDAEngineUserClient::getHardwareVolume() AppleHDAEngineUserClient::getStateAction(UserClientData) AppleHDAEngineUserClient::setHardwareVolume() AppleHDAEngineUserClient::setStateAction(UserClientData) |
| P-Diff: entry functions for function AppleHDAPathSet::isAmplifierMuteCapable() AppleHDAEngineUserClient::setSpatialChannelMute() AppleHDAEngineUserClient::setStateAction(UserClientData) |
Table 5: User-mode entry points for changed functions in AppleHDA.kext.
As we have mentioned before, the key methodology for dynamic analysis is to get the runtime context of the attack interface API in order to help trigger, fuzz or even reproduce the potential vulnerability.
As our best practice, we would choose Frida to control and trace user-mode context and Dtrace to trace the kernel counterpart. As a manual alternative, debugging (via lldb) both the user and kernel is reasonable.
Table 6 shows a basic comparison of different typical dynamic traces according to difference dimensions.
| User trace | Kernel trace | Embedded in OS | Any privilege? | Support script? | Performance | Platform | |
| Frida | Yes | No | No | Root or Repack | Yes | Middle | iOS/OSX |
| Dtrace | No | Yes | Yes | Root | Yes | High | OSX |
| lldb | Yes | Yes | Yes | Root | Yes | Low | iOS/OSX |
| Kernel hook | --- | Yes | No | Root | No | Middle | OSX |
Table 6: Comparison of dynamic traces.
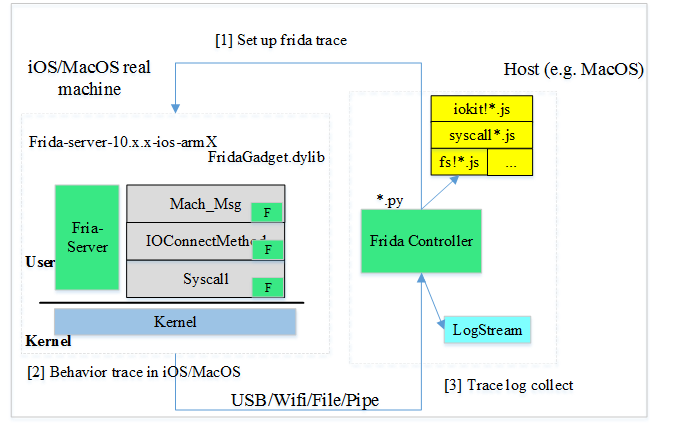
Figure 25: Frida hook in user mode.
Frida is one of the most popular dynamic instrumentation toolkits on many platforms including MacOS and iOS. One of its advantages is that it allows you to peek at and control every function using well documented JavaScript APIs which include the pre and post event handling. Typically, the retrieved runtime information includes call stack backtrace, thread context, return value, and any other you define. Take the xpc_connection_send_message API context for example, as shown in Listing 3.
{"time":"2017-09-18T10:38:32.807Z",
"txnType":"moony?",
"lib":"libxpc.dylib",
"method":"xpc_connection_send_message",
"artifact":[{
    "name":"connection",
    "value":"0x1658d090","argSeq":0}, {"name":"connectioninfo","value":"\tconnection=0x1658d090\tconnectionName=\tconnectionPid=231
\tconnectionProcName=Preferences","argSeq":0},
    {"name":"retval","value":374477440,"argSeq":-1}
]}
Listing 3: Xpc_connection_send_message API.
As the basic steps to use Frida, first launch the Frida server under root privilege or repack the Frida gadget in the target application, then you can develop your own JavaScript code for hooking any API you want in the Frida controller. The trace log generated by the Frida server is sent to the Frida controller for further analysis via USB or network.
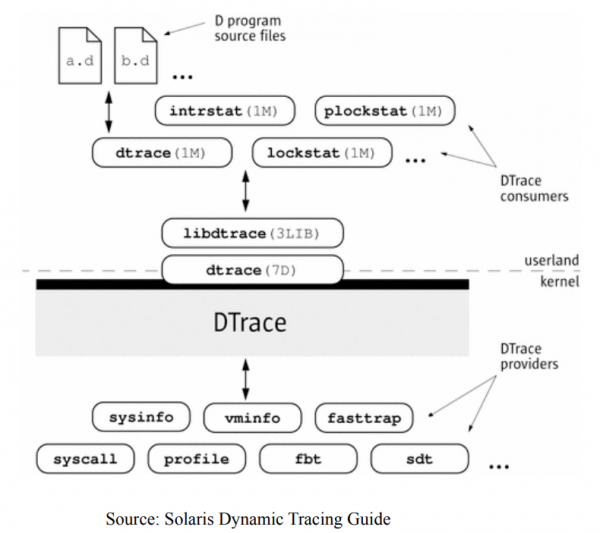
Figure 26: Dtrace architecture. (Source: Solaris Dynamic Tracing Guide.)
Dtrace has one the best tracing designs, with high performance and usability in Unix-like systems including OSX (unfortunately, Dtrace is not officially supported on iOS devices), as can be seen from the architecture shown in Figure 26.
Dtrace also provides multiple probes embedded in the kernel with categories such as sysinfo, syscall, fbt, sdt and so on. The typical system call, IOKit, mach msg, network, disk and file are almost all covered by Dtrace probes. Figure 27 shows the Dtrace providers list.
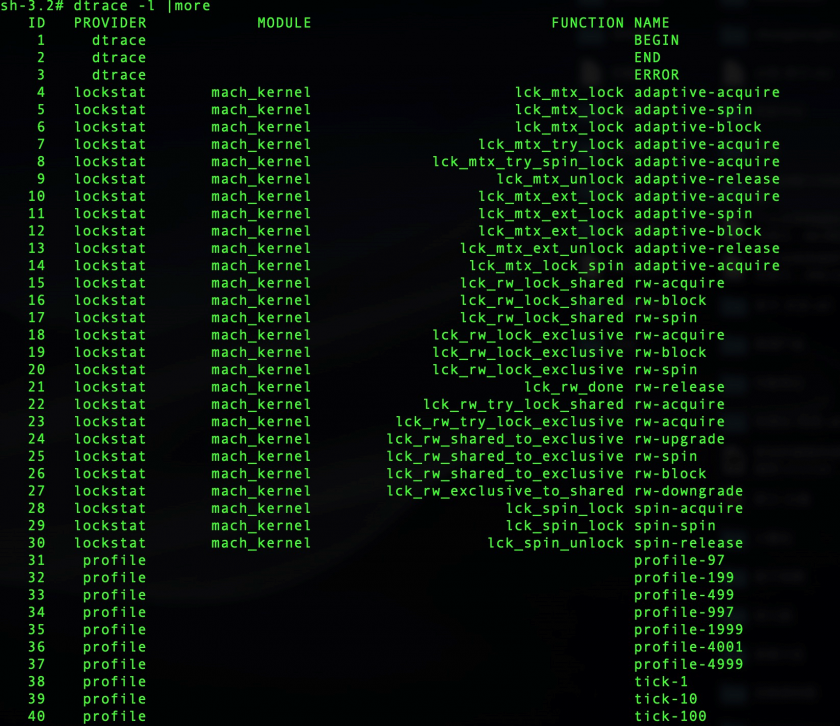 Figure 27: Dtrace providers list.
What is more, D language (*.d) in script provides fruitful APIs to intercept pre or post event (e.g. BEGIN,END) and keywords related to runtime process context (e.g. PID, timestamp, filename, exe name and so on). Thus you can see the code pieces for the IOFile probe. Figure 28 shows the Dtrace script for file probe.
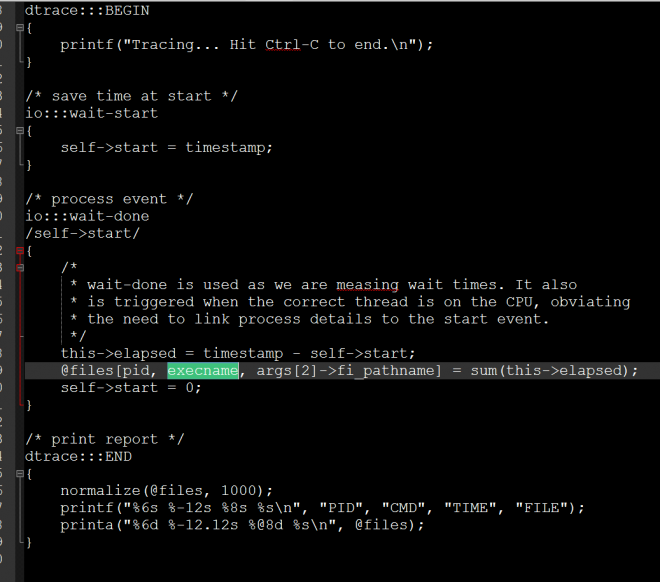 Figure 28: Dtrace script for file probe.
Another useful dynamic trace tool is lldb embedded in OSX and iOS systems. Besides typical debugging utilities such as single step, break point, memory read/write operations and thread info, lldb can debug any user-mode service or process and even the whole OSX kernel. Lldb also supports python script to wrap the typical lldb-related objects (e.g. thread, process, module, memory, lldb attach) and operation with good documentation. In fact, we not only traced the API sequences we are interested in dynamically, but we also fuzzed the kernel to reproduce lots of kernel crashes, details of which will be announced in another paper.
We want some kind of enhanced OSX/iOS kernel fuzzing system, which is currently under development since we know the technical details of the kernel interface APIs from the viewpoint of static and dynamic analysis.
As the key methodology for fuzzing, we would like to touch as much of the execution path (code coverage) as possible and also catch the first spot of the kernel crash.
The first step of fuzzing is to try to generate a fruitful corpus of kernel interface APIs and call the kernel from the user agent. Besides blind fuzzing using tools like Trinity, we recommend using normal programs which have more opportunities to interact with kernels than the agent. For example, playing 3D games that use openGL or graphics drivers, operating peripheral devices (e.g. Wi-Fi, Bluetooth management), and so on. These kinds of real kernel API call could eventually touch ‘deeper’ kernel code execution paths because the legal input parameters have already bypassed most trick kernel checks.
As the second step, the passive fuzzer intercepts the typical API in the kernel counterpart usually as an inline hook for pre and post event handling. By fuzzing the input data of the API parameter (usually as buffer content of an argument, or kernel/user shared memory) in special time strategy, you could probably get plenty of kernel crashes.
The kernel sanitizer mechanism (such as KASAN, kernel address sanitizer) could be useful for improving the quantity and quality of fuzzing. Without a sanitizer mechanism, a crash caused by a memory corruption vulnerability may be handled or dismissed by the kernel code itself. What is more, there would exist instruction sequence disorder between the root cause point and the final instruction pointed to by RIP in one crash, which could cost more analysis effort for researchers.
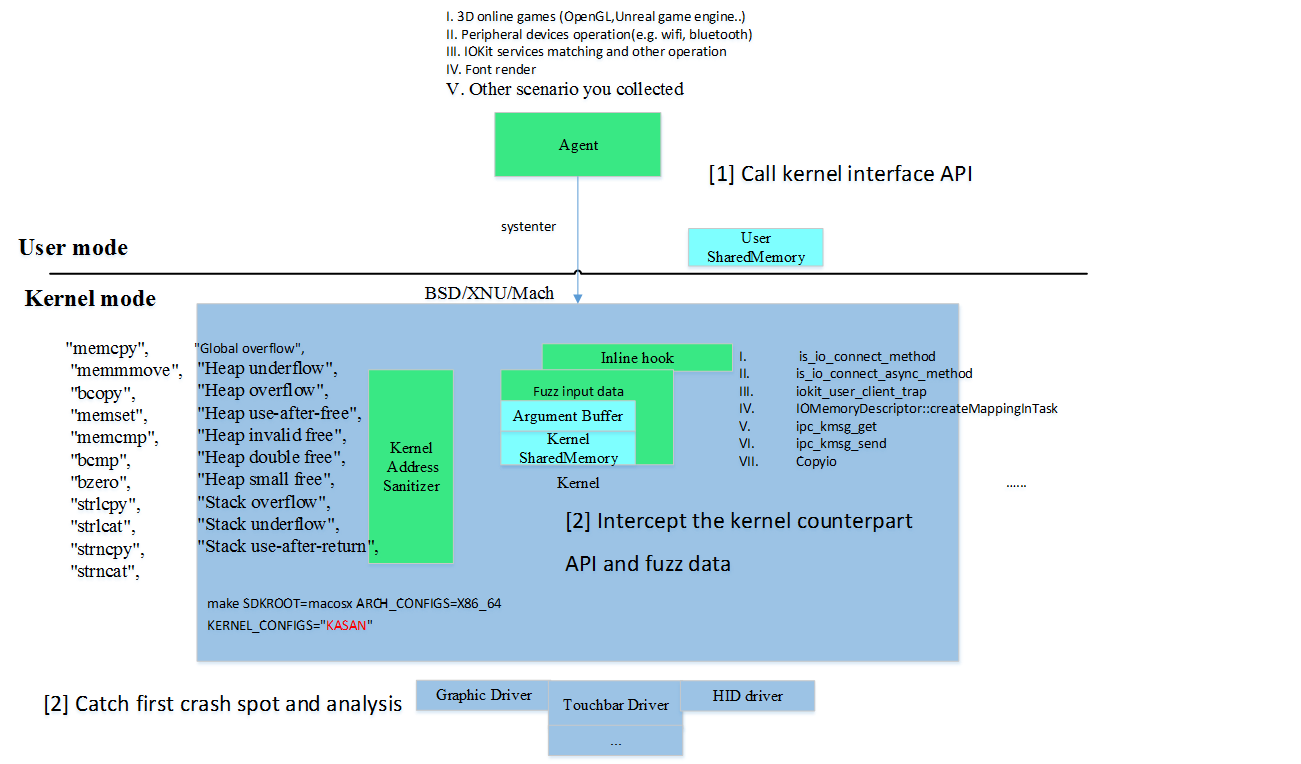 Figure 29: Enhanced kernel fuzz.
KASAN (kernel address sanitizer) is one of the standard sanitizers supported by popular operating systems including OSX which could help catch the crash spot so as to identify the root cause of the vulnerability and reproduce it much more easily.
What is lucky is that the KASAN feature is officially supported in XNU building, so you could build your own XNU kernel like this and replace the original in /System/Library/Kernels/:
make SDKROOT=macosx ARCH_CONFIGS=X86_64 KERNEL_CONFIGS=”KASAN”
In fact, as the implementation of KASAN in XUN uses extra memory for tracing, it would guard any memory address allocating, freeing and referencing (e.g. memcpy, memcpy, bcopy) in the source code at instruction level such as variable in stack, heap and so on. In this way, the typical memory error such as buffer (stack, heap) overflow and UAF (use after free) in XUN could be caught in the first crash spot. Figure 30 shows the code pieces in __Xio_connect_method in the kernel.
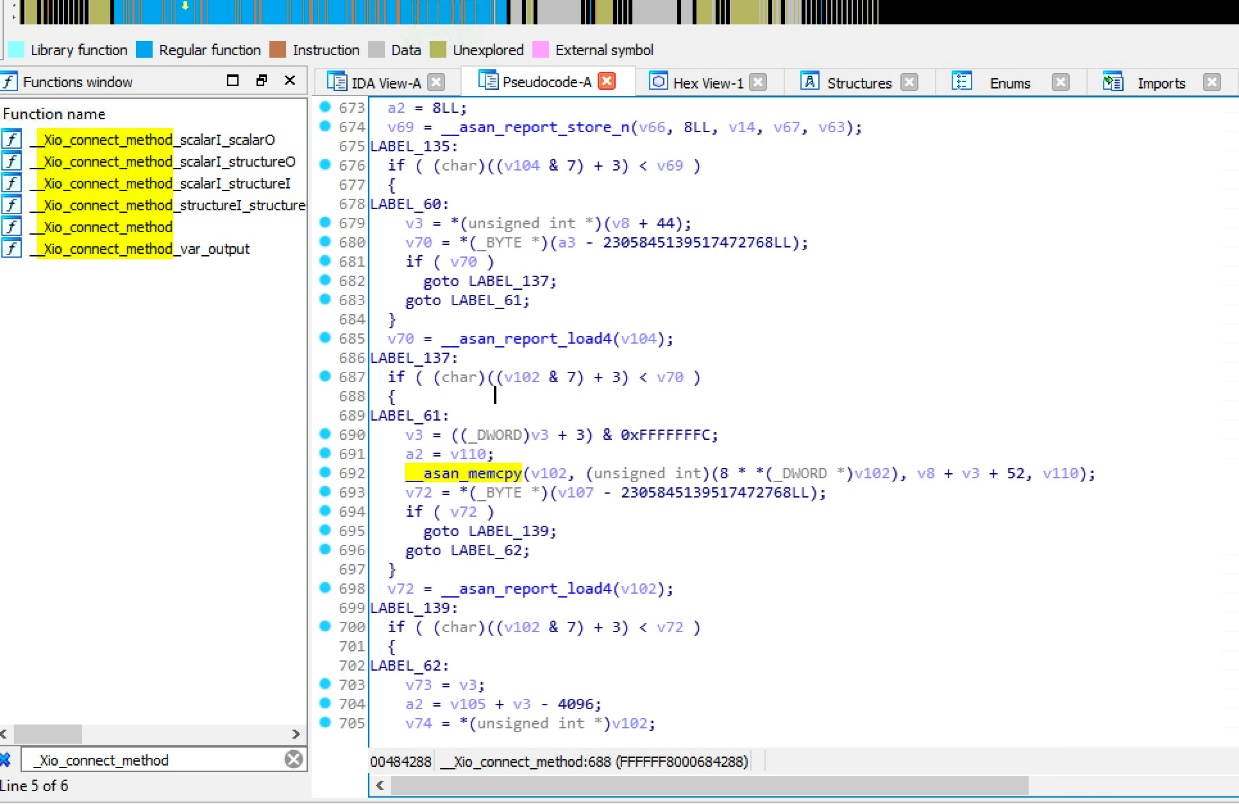
Figure 30: KASAN in __Xio_connect_method.
As we have mentioned, we want to touch as much of the execution path (code coverage) as possible. In our experience, the typical kernel API could be one of the best hooking points, which contains IOKit control, memory share, mach msg method and system call.
When the CPU executes instructions to this kind of kernel API, many routine checks (e.g. send correct message id to the correct user client) have been made, which could reduce the useless blind fuzzing corpus and save fuzzing time.
Besides simple tampering with the input data, we could introduce a more advanced fuzzing method at this point. As part of our further research, we could locate our agent in kernel mode towards the kernel API and support code coverage feedback by static or dynamic instrumentation. You could imagine it as syzkaller or AFL in kernel mode.
As we know, the runtime environment in the kernel would be complex. There would exist much environment preparation or initialization (e.g. open the correct service, initialize the target devices and send the correct mach message id) before a special kernel API (e.g. IOConnectionCallMethod) could work properly. So why don’t we intercept the kernel API at the proper time under the proper state and fuzz it like AFL does, directly in kernel mode?
In fact, porting a kernel sanitizer mechanism to a closed-source driver on iOS/OSX is possible if we want expand the memory guard for the whole kernel mode. Every kernel module (including driver) would utilize the memory management service provided by the kernel via API (e.g. kmem_alloc, bcopy). Modifying the memory API to asan_* in the import table in the driver module, or patching the code with memory management in the driver to support the kernel sanitizer could be investigated in further research.
Figure 31 is a backtrace of the crash point. The extGetPixelInformation() method is one of the IOFramebufferUserClient methods whose selector is 1. This method takes three scalar data inputs, which are displayMode, depth and aperture, and returns the pixel information.
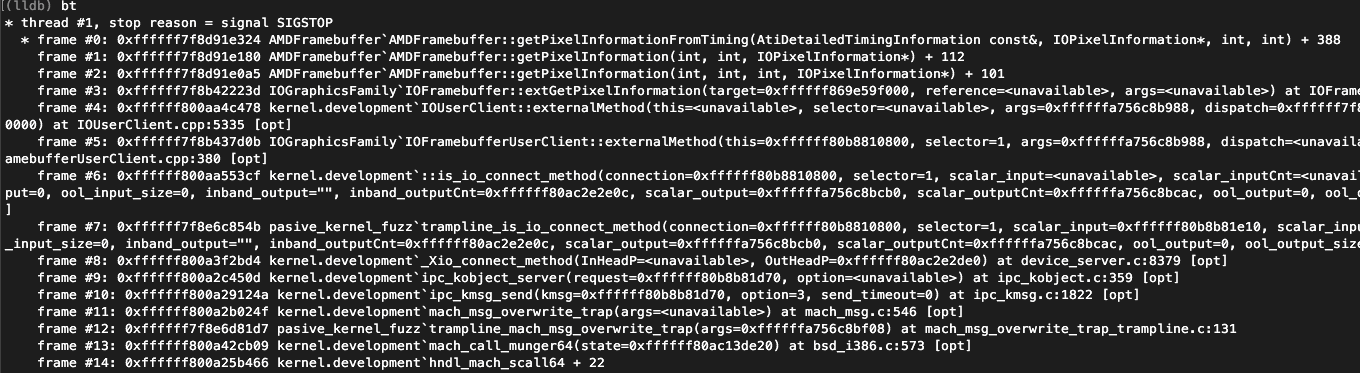
Figure 31: Backtrace of the integer overflow.
Figure 32 is an assembly snippet of the crash point which is in the method AMDFramebuffer::getPixelInformationFromTiming(AtiDetailedTimingInformation const&, IOPixelInformation*, int, int). From the code snippet and the debug info, we can see that the register ‘rdi = 0xfffffffff2000001’ is so big it is out of boundary. And after this buffer read operation, this function use the ‘Utilities::str_copy’ function to copy ‘sizeof(IOPixelInformation*)’ bits of pixel information to the caller, so it can leak the kernel information to the user-mode process.
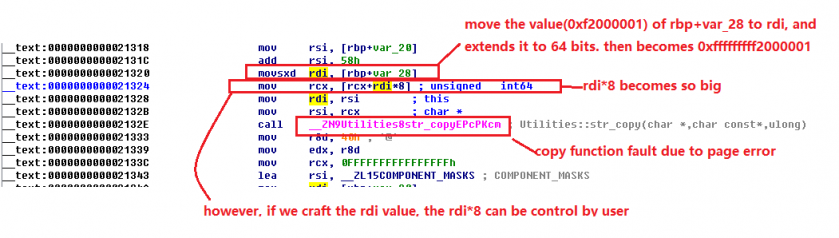
Figure 32: Code snippet for the crash point.
Figure 33 shows the backtrace of this untrusted pointer de-reference issue. This vulnerability can be triggered on Mac mini. ‘IntelAccelerator’ is a service delivered by the Intel graphics driver, it can be opened from a user-mode process.
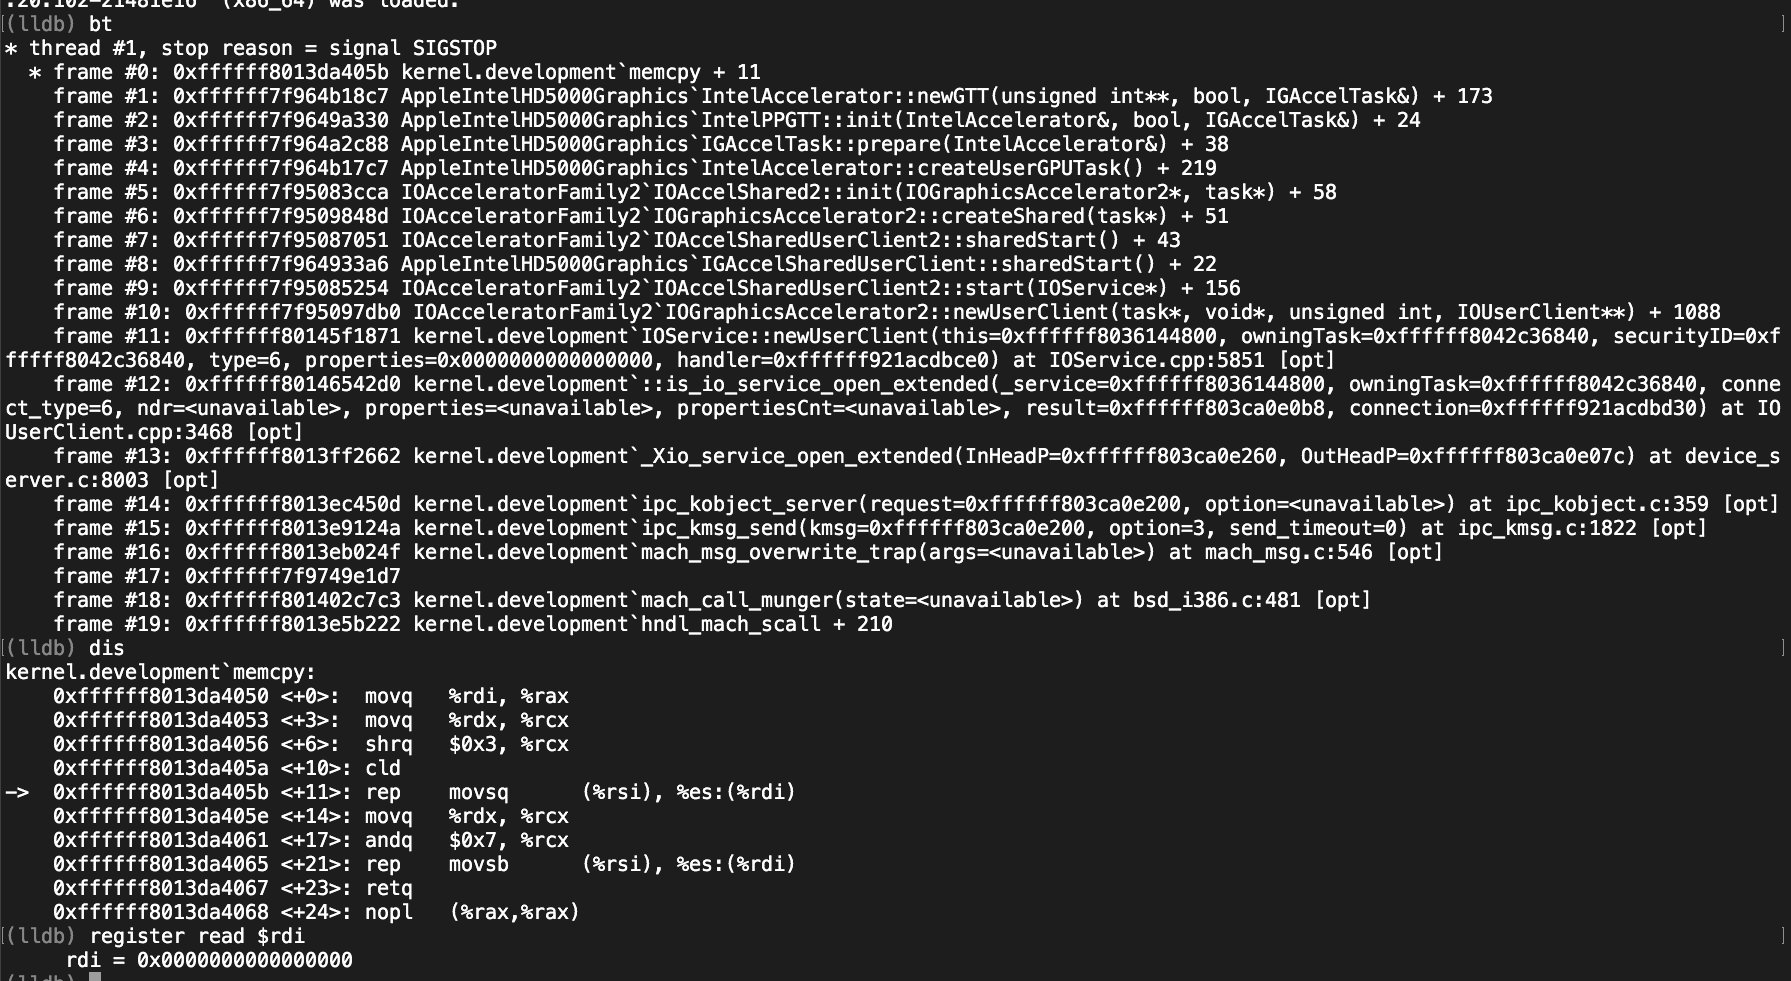
Figure 33: Crash info for the intelAccelerator driver NULL PAGE read operation.
Figure 34 shows the arguments list for the ‘newUserClient’ function when this service is opened. When connection type is 6 and the properties are NULL, this vulnerability will be triggered.
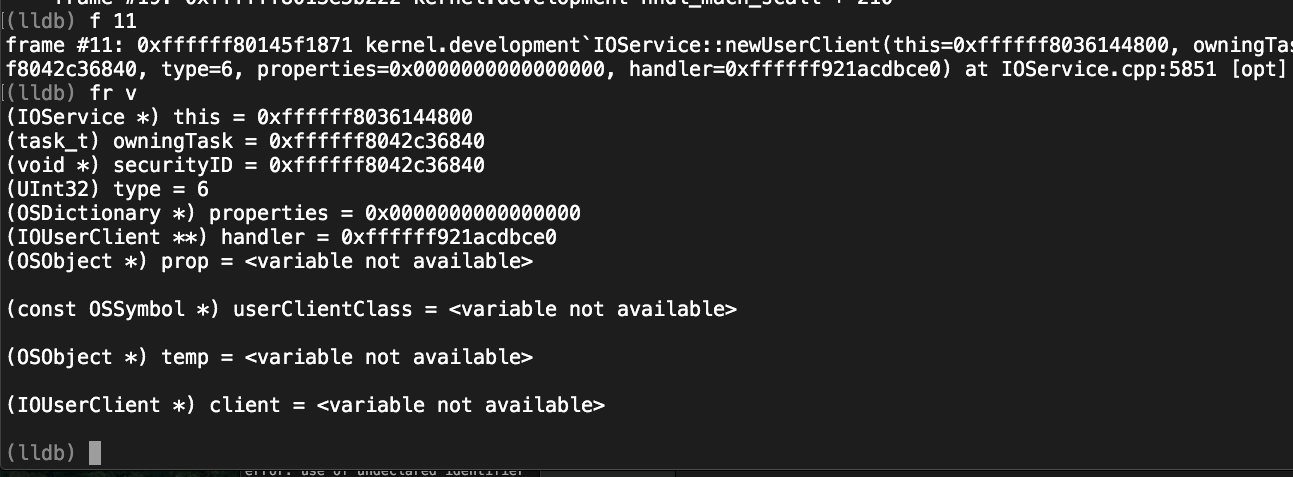 Figure 34: Arguments list for newUserClient function when this bug is triggered.
The IOUSBFamily driver provides an external method for a user-mode process which is called IOUSBFamily`IOUSBInterfaceUserClient::LowLatencyPrepareBuffer. This function can be called by IOConnectCallMethod with selector 17. Figure 35 shows the backtrace of the crash point.
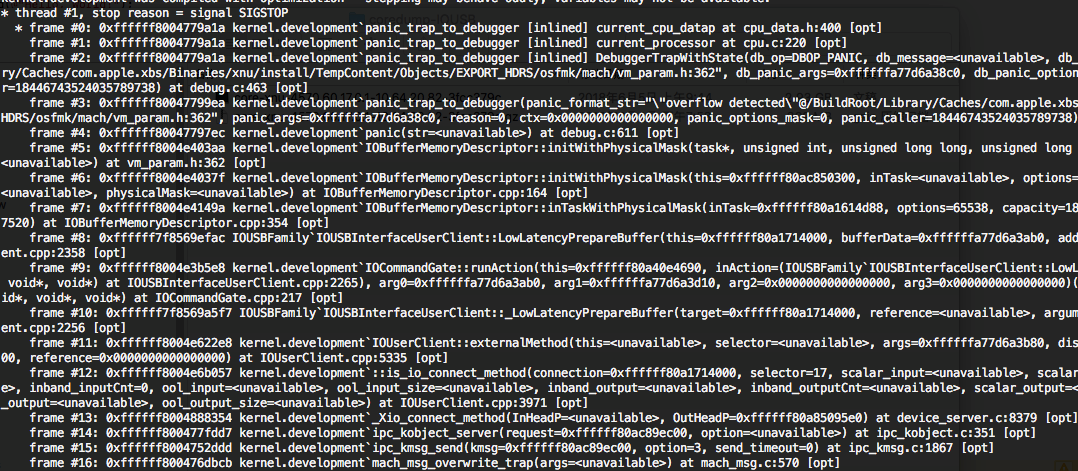 Figure 35: Backtrace for the crash point.
A capacity argument is needed for this function. The IOUSBInterfaceUserClient::_LowLatencyPrepareBuffer function will copy the input_scalar[0~4] data for the IOUSBFamily`IOUSBInterfaceUserClient::LowLatencyPrepareBuffer function directly. But the input scalar content is transferred from user space, so we can control the capacity to a large degree to trigger this bug.
IOAccelCommandQueue is used to process the graphic accelerator command information for 3D rendering. This vulnerability occurred in selector 1 whose function name is ‘IOAccelCommandQueue::s_submit_command_buffers’ with open type 9. When an AMDRadeonX4000 driver processes these command, it will prepare the AMDAccelResource first. However, there are many divide operations in this process, and a lack of zero checking.
These vulnerabilities were found in the latest MacOS (10.14.3) system. Listing 4 shows the backtrace of this bug.
Listing 5 shows an assembly code snippet of this vulnerable function. The r12d register is initialized with zero. It will be assigned a new value within the omitted code if it meets some condition, but this is not certain, therefore, it will result in a divide zero bug in the place b.
__text:00000000000BB75B                 div     esi
__text:00000000000BB75D                 mov     r14d, 0
__text:00000000000BB763                 mov     r12d, 0          -----init r12d with 0                                 --(a)
__text:00000000000BB769                 test    edx, edx
  …..
  -----omitted code ----
  …..
__text:00000000000BB93C loc_BB93C:                              ; CODE XREF: BltMgr::HwlOptimizeBufferBltRects(BltInfo *,uint)+3E1j
__text:00000000000BB93C                 xor     edx, edx
__text:00000000000BB93E                 mov     eax, r13d
__text:00000000000BB941                 div     r12d                -----r12d is not always nonzero              ---(b)
__text:00000000000BB944                 cmp     eax, r14d
__text:00000000000BB947                 jbe     short loc_BB95B
__text:00000000000BB949                 mov     dword ptr [rsi+rbx-0Ch], 0
__text:00000000000BB951                 mov     [rsi+rbx-4], r12d
__text:00000000000BB956                 mov     eax, r14d
__text:00000000000BB959                 jmp     short loc_BB97C
Listing 5: Asm code snippet of the BltMgr::HwlOptimizeBufferBltRects function.
AMDRadeonX4000_AMDAccelResource is used to process the graphic accelerator resource information for 3D rendering. This vulnerability occurred in selector 0, whose function name is ‘IOAccelSharedUserClient2::s_new_resource’ with open type 6. This vulnerability was found in the latest MacOS (10.14.3) system.
Listing 6 shows the backtrace of this OOB bug.
* thread #1, stop reason = signal SIGSTOP
    * frame #0: 0xffffff7fa00965d3 AMDRadeonX4000'AMDRadeonX4000_AMDAccelResource::initialize(IOAccelNewResourceArgs*, unsigned long long) + 1525
     frame #1: 0xffffff7f9fea346b IOAcceleratorFamily2'IOAccelSharedUserClient2::new_resource(IOAccelNewResourceArgs*, IOAccelNewResourceReturnData*, unsigned long long, unsigned int*) + 1893
     frame #2: 0xffffff7f9fea4a41 IOAcceleratorFamily2'IOAccelSharedUserClient2::s_new_resource(IOAccelSharedUserClient2*, void*, IOExternalMethodArguments*) + 151
     frame #3: 0xffffff801d625ab8 kernel.development'IOUserClient::externalMethod(this=<unavailable>, selector=<unavailable>, args=0xffffff83dd4b3b58, dispatch=0xffffff7f9fee8260, target=0xffffff80854fd780, reference=0x0000000000000000) at IOUserClient.cpp:5358 [opt]
     frame #4: 0xffffff7f9fea4d98 IOAcceleratorFamily2'IOAccelSharedUserClient2::externalMethod(unsigned int, IOExternalMethodArguments*, IOExternalMethodDispatch*, OSObject*, void*) + 120
     frame #5: 0xffffff801d62eb7f kernel.development'::is_io_connect_method(connection=0xffffff80854fd780, selector=0, scalar_input=<unavailable>, scalar_inputCnt=<unavailable>, inband_input=<unavailable>, inband_inputCnt=2424, ool_input=0, ool_input_size=0, inband_output="", inband_outputCnt=0xffffff806ba03e0c, scalar_output=0xffffff83dd4b3ce0, scalar_outputCnt=0xffffff83dd4b3cdc, ool_output=0, ool_output_size=0xffffff8085919d5c) at IOUserClient.cpp:3994 [opt]
    frame #6: 0xffffff801cfbbce4 kernel.development'_Xio_connect_method(InHeadP=<unavailable>, OutHeadP=0xffffff806ba03de0) at device_server.c:8379 [opt]
     frame #7: 0xffffff801ce8d27d kernel.development'ipc_kobject_server(request=0xffffff8085919000, option=<unavailable>) at ipc_kobject.c:359 [opt]
    frame #8: 0xffffff801ce59465 kernel.development'ipc_kmsg_send(kmsg=0xffffff8085919000, option=3, send_timeout=0) at ipc_kmsg.c:1832 [opt]
     frame #9: 0xffffff801ce78a75 kernel.development'mach_msg_overwrite_trap(args=<unavailable>) at mach_msg.c:549 [opt]
     frame #10: 0xffffff801cff6323 kernel.development'mach_call_munger64(state=0xffffff806ca9c480) at bsd_i386.c:573 [opt]
    frame #11: 0xffffff801ce23486 kernel.development'hndl_mach_scall64 + 22
Listing 6: The backtrace of this OOB bug.
As shown in Listing 7, the register of rax is the address of the buffer which is created from the IOMalloc function. The r15 register points to the structureInput buffer which is controlled by user mode. The ecx register stores the length of the IOMalloc buffer. The rdx register is used as an index to copy the structureInput buffer content to the IOMalloc buffer. However, here, ecx is obtained directly from user mode which is structureInput at offset 62 dword. So, if we set ecx to a high value, it will read overflow from the structureInput buffer.
__text:000000000000E58E loc_E58E:            ; CODE XREF: AMDRadeonX4000_AMDAccelResource::initialize(IOAccelNewResourceArgs *,ulong long)+58Dj
__text:000000000000E58E                 mov     ecx, [r15+0F8h]
__text:000000000000E595                 test    rcx, rcx
__text:000000000000E598                 jz      short loc_E603
__text:000000000000E59A                 shl     rcx, 3
__text:000000000000E59E                 lea     rdi, [rcx+rcx*2]
__text:000000000000E5A2                 call    _IOMalloc
__text:000000000000E5A7                 mov     [r12+178h], rax  --- rax== buffer address which create by IOMalloc
__text:000000000000E5AF                 test    rax, rax
__text:000000000000E5B2                 jz      short loc_E62A
__text:000000000000E5B4                 or      byte ptr [r12+186h], 8
__text:000000000000E5BD                 mov     ecx, [r15+0F8h]  --------r15==structureInput, ecx=( (uint32_t*) structureInput+62)
__text:000000000000E5C4                 mov     [r12+180h], ecx
__text:000000000000E5CC                 test    rcx, rcx
__text:000000000000E5CF                 jz      short loc_E639
__text:000000000000E5D1                 xor     edx, edx
__text:000000000000E5D3
__text:000000000000E5D3 loc_E5D3:          ; CODE XREF: AMDRadeonX4000_AMDAccelResource::initialize(IOAccelNewResourceArgs *,ulong long)+621j
__text:000000000000E5D3                 mov     rsi, [r15+rdx+98h]  ---- mov structureInput+rdx+0x98 to rsi
__text:000000000000E5DB                 mov     [rax+rdx], rsi  ----mov rsi to rax+rdx, rax== buffer address which create by IOMalloc
__text:000000000000E5DF                 mov     rsi, [r15+rdx+0A0h]
__text:000000000000E5E7                 mov     [rax+rdx+8], rsi
__text:000000000000E5EC                 mov     esi, [r15+rdx+0A8h]
__text:000000000000E5F4                 mov     [rax+rdx+10h], esi
__text:000000000000E5F8                 add     rdx, 18h
__text:000000000000E5FC                 dec     rcx
__text:000000000000E5FF                 jnz     short loc_E5D3
Listing 7: Asm code snippet of AMDRadeonX4000_AMDAccelResource::initialize.
[1] Angr. https://github.com/angr/angr.
[2] Miasm. https://github.com/cea-sec/miasm.
[3] ARM Architecture Reference Manual. https://cs.nyu.edu/courses/spring18/CSCI-GA.2130-001/ARM/arm_arm.pdf.
[4] Joker. http://www.newosxbook.com/tools/joker.html.
[5] CodeRefsFrom(ea, flow). https://www.hex-rays.com/products/ida/support/idapython_docs/idautils-module.html#CodeRefsFrom.
[6] BinDiff. https://www.zynamics.com/bindiff.html.
[7] Meld. http://meldmerge.org/.
[8] iOS Security Guide. https://images.apple.com/business/docs/iOS_Security_Guide.pdf.
![]()