2012-09-01
Abstract
In the first part of this tutorial series Aleksander Czarnowski described some fundamental differences between the 32- and 64-bit Windows PE+ file format and looked at using the Bochs IDA plug-in to find the original entry point of a file. In part two, he describes using WinDbg and demonstrates a different approach to the unpacking process.
Copyright © 2012 Virus Bulletin
In the first part of this tutorial series (see VB, July 2012, p.11) I described some fundamental differences between the 32- and 64-bit Windows PE+ file format. In that article, we looked at using the Bochs IDA plug-in to find the original entry point of a file. In this article I will describe using WinDbg and demonstrate a different approach to the unpacking process.
Before we start our analysis the first thing we need to do is to install WinDbg in the form of the Microsoft Windows Debugging Tools package [1]. Keep in mind that debugging tools are available for 32- and 64-bit platforms. You can install both on the same host, but for the rest of this tutorial we will be using the x64 version only.
After installing WinDbg, the next thing we need to do is set up a symbol server – this will be handy when we step over system DLLs and other Windows components. In order to do this, enter the following line into the ‘Symbol file path’ window (File->Symbol file path or use the Ctrl+S shortcut):
srv*DownstreamStore*http://msdl.microsoft.com/download/symbols;srv*
In case of problems with symbols you can always reload them using the .reload command (note the dot preceding the command). Since we are using a remote, public symbol store provided by Microsoft, our host needs an Internet connection. In the case of a real lab this requirement may be impossible to meet. In such a case you need to download the symbols and enter the path to the directory into which you have downloaded them.
WinDbg is definitively not user-friendly, and the more time you spend learning IDA’s quirks the more frustrating it will be to work around WinDbg-specific behaviour. Unfortunately, IDA’s built-in native debugger can’t handle ring 0 code yet, meaning, for example, that unpacking kernel drivers dynamically is not possible. In short: there are times when you might be forced to switch from your favourite tool to WinDbg (unless WinDbg is your favourite tool, which is something to be proud of I guess). In terms of unpacking 32-bit PE files, WinDbg has one important advantage over other tools like IDA and especially over OllyDbg/Immunity Debugger – it is targeted a lot less by malware authors than the others. Many anti-Olly debugging tricks do not work under WinDbg, and I’m aware of at least a few cases when people fed up with having to bypass numerous protection/anti-debugging/obfuscation layers have switched from Olly to WinDbg and found that arriving at the original entry point was very swift.
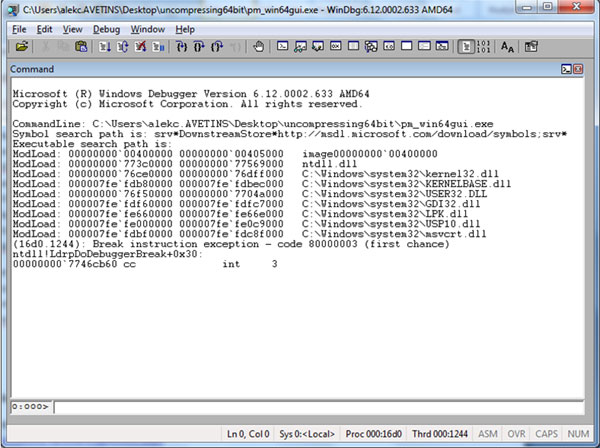
After this short introduction let’s get back to work. Let’s assume for a moment that our packed test executable is still unknown to us and we don’t know anything about the tools being used to compress it. In order to proceed with our analysis we need to open the executable file (File->Open Executable or Ctrl+E). This will trigger the loading of symbols and all modules required by the executable, and the initial breakpoint will be hit at:
ntdll!LdrpDoDebuggerBreak+0x30:
00000000`7746cb60 cc         int   3
This breakpoint is always set by WinDbg by default. While sometimes such behaviour might be handy, in our case it is a bit useless since we need to break at our process entry point and not somewhere in ntdll.
There are two methods we can use to achieve this: the long and more complicated one, and the short one. I’ll start with the longer one since it teaches us a bit about Windows operating system structures and the way they are used by the operating system when loading executable modules into memory.
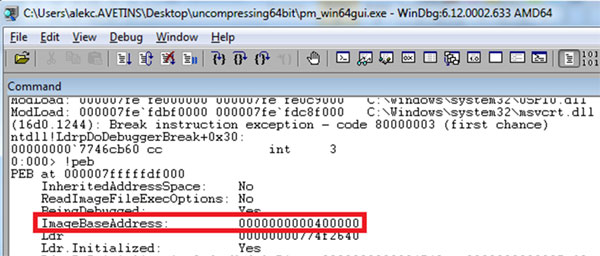
The ‘!peb’ command displays the debugged Process Environment Block (PEB) [2], [3] (unless you specify an address as a command argument). The result of the ‘!peb’ command is shown in Figure 2. Note that from the PEB information we can learn:
The ImageBaseAddress value – we will need this to find the current entry point. Keep in mind that the current entry point has nothing to do with the original entry point.
That the BeingDebugged flag is set, signalling that the process is being debugged. This is the same flag as the kernel32 IsDebuggerPresent() function is checking.
Since we have the ImageBaseAddress (0000000000400000 in our case) we have to find the second part of the process entry point address. This reflects the PE+ header where the entry point address is calculated by adding the values of two fields:
ImageBase (eight bytes in the case of PE+)
AddressOfEntryPoint (four bytes both for PE and PE+). In [4], the AddressOfEntryPoint is described as: ‘The address of the entry point relative to the image base when the executable file is loaded into memory. For program images, this is the starting address. For device drivers, this is the address of the initialization function. An entry point is optional for DLLs. When no entry point is present, this field must be zero.’
Since our file is not a device driver, AddressOfEntryPoint will point at the entry point (keep in mind that the instruction at the entry point might not be the first to be executed when running the executable module due to the functionality of TLS callbacks).
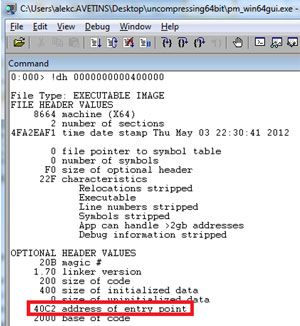
Now we need to find the value of the AddressOfEntryPoint field. Unfortunately it is not available in the PEB information. However, we can use the ‘!dh’ command (note that all commands starting with an exclamation mark in WinDbg are in fact extensions) to display it. The ‘!dh’ command requires the base address of the image we want to parse. Fortunately, the PEB has given us this information. So we issue the command:
!dh 0000000000400000
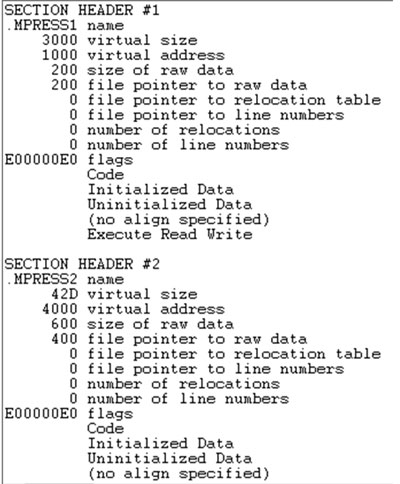
The output not only reveals the address we are looking for (see Figure 3), but also shows us information about the file sections (Figure 4).
Now we can add the ImageBaseAddress and AddressOfEntryPoint values to find out the final address we were looking for:
ImageBaseAddress + AddressOfEntryPoint = Entry Point
0000000000400000 + 40C2 = 00000000004040C2
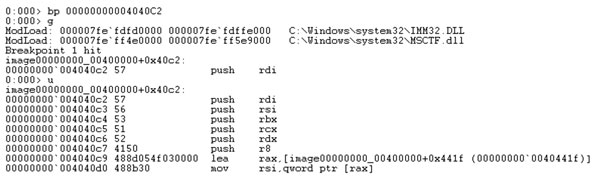
This allows us to set a breakpoint at 00000000004040C2 using the ‘bp’ command:
bp 00000000004040C2
Now we can finally run our target application using the ‘g’ command – see Figure 5.
If you disassemble the rest of the entry point Prolog code using the ‘u’ command you will find out that the code starts by pushing different registers onto the stack. Using this fact we can assume that the RDI register and other registers can be restored before jumping to the original entry point. If this assumption is correct, we can use a completely different strategy from that described in the previous part of this tutorial. Instead of tracing system calls we could set up a breakpoint on accessing the stack, hoping that right before transferring execution to the original entry point, this location will be read. Such tactics will allow us to completely bypass the decompression loop and import table address fixing loops. Since WinDbg does not provide anything similar to the IDA uunp plug-in out of the box, we might take our chances with the described approach since we don’t need any of the information we gathered in the previous tutorial. Now we can use the ‘t’ command, which stands for trace (but we could also use the ‘p’ command (step) in this case) to execute the ‘PUSH RDI’ instruction.
Now we need to enter the breakpoint on memory access – this is what the ‘ba’ (break on access) command stands for. As with many other commands its syntax is rather cryptic at first sight:
ba r 8 rsp
The ‘r’ stands for read access. Other possible access types are:
e – execution (the process retrieves an opcode from the address)
w – write
i – i/o access
The second argument is the size of a region which, in case of access, will trigger the breakpoint. Since all 64-bit registers occupy eight bytes, we are interested in eight bytes on the stack.
The third and final argument in our example is the address of the breakpoint. Since we have a stream of PUSH [reg] instructions starting at 0x04040c2, we can put our breakpoint at the current stack pointer (which has been modified by the PUSH RDI instruction we’ve just executed with the trace command). Obviously the current stack pointer address is kept in the RSP register. If you like you can pass the memory address instead of the register value.
Now we just need to execute our target with the ‘g’ command – the following is the listing of the whole of our session:
Breakpoint 1 hit
image00000000_00400000+0x40c2:
00000000`004040c2 57   push rdi
0:000> u
image00000000_00400000+0x40c2:
00000000`004040c2 57   push  rdi
00000000`004040c3 56   push  rsi
00000000`004040c4 53   push  rbx
00000000`004040c5 51   push  rcx
00000000`004040c6 52   push  rdx
00000000`004040c7 4150 push  r8
00000000`004040c9 488d054f030000  lea     rax,[image00000000_00400000+0x441f (00000000`0040441f)]
00000000`004040d0 488b30     mov   rsi,qword ptr [rax]
0:000> t
image00000000_00400000+0x40c3:
00000000`004040c3 56   push  rsi
0:000> ba r 8 rsp
0:000> g

Breakpoint 2 hit
image00000000_00400000+0x1180:
00000000`00401180 e97b0e0000 jmp   image00000000_00400000+0x2000 (00000000`00402000)
0:000> t
image00000000_00400000+0x2000:
00000000`00402000 4883ec28   sub   rsp,28h
0:000> u
image00000000_00400000+0x2000:
00000000`00402000 4883ec28         sub   rsp,28h
00000000`00402004 41b900000000     mov   r9d,0
00000000`0040200a 49c7c000104000   mov   r8,offset image00000000_00400000+0x1000 (00000000`00401000)
00000000`00402011 48c7c20e104000   mov   rdx,offset image00000000_00400000+0x100e (00000000`0040100e)
00000000`00402018 4831c9           xor   rcx,rcx
00000000`0040201b ff152b100000     call  qword ptr [image00000000_00400000+0x304c (00000000`0040304c)]
00000000`00402021 89c1             mov   ecx,eax
00000000`00402023 ff1513100000     call  qword ptr [image00000000_00400000+0x303c (00000000`0040303c)]
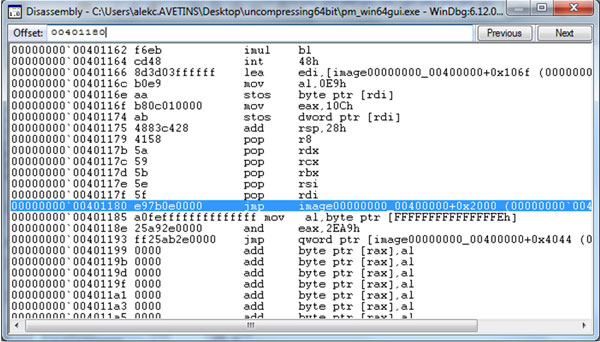
As you can see, when breakpoint 2 is hit the RIP point at 0x401180 contains a suspicious JMP instruction:
00000000`00401180 e97b0e0000 jmp image00000000_00400000+0x2000 (00000000`00402000)
This looks like an execution flow transfer to the original entry point (OEP). You can now open the disassembly window (Figure 6) with the View->Disassembly option. You can see that before our jump instruction there is a stream of POP opcodes which is a hint that default register values are being restored. After the jump we definitely see some garbage code. Compilers usually lay code out in some order and are not trying to waste space (unless we are talking about DEBUG type compilation for example).
Let’s execute this jump with the t(race) command and disassemble the code at the new RIP location using the ‘u’ command just as shown in the session above. Since our code starts with the SUB RSP instruction this might be a hint that we are in fact at the original entry point. Further code inspection and execution confirms this.
Setting a breakpoint on the first stack access seems reasonable since after unpacking, the stack must be restored to its initial state, just like used registers. However, it might be a wise strategy to set up breakpoints after the next PUSH and in consequence on a lower RSP value or even set a breakpoint for the whole stack memory region used by storing the initial register values at the beginning of our packed file.
Coming back to the first part of this tutorial we used a completely different approach with IDA: setting breakpoints on some crucial API functions that were in the Import Table. The same method can be applied when unpacking with WinDbg. Unfortunately, WinDbg does not automatically create nice table views of the import and export directories of PE+ files like IDA does. You can inspect those tables with WinDbg, obviously, but as always it requires a bit of additional work and poking around in process memory. IDA does it automatically in most cases. However, nothing stops us from using the function breakpoint method described in the first part with WinDbg. Furthermore, if you are willing to reconstruct the IAT you will need to analyse the unpacking process more carefully. Right now we’ve just found the OEP.
In order to set breakpoints on APIs let’s restart our target application and set a breakpoint on the entry point. When the breakpoint is being hit we can add breakpoints for Windows API functions like GetProcessAddress and GetModuleHandleA (those functions are in the import table). Use the ‘bp’ command to set normal breakpoints on those functions:
Breakpoint 1 hit
image00000000_00400000+0x40c2:
00000000`004040c2 57         push  rdi
0:000> bp kernelbase!getprocaddress
0:000> bp kernelbase!getmodulehandlea
0:000> g

Breakpoint 3 hit
KERNELBASE!GetModuleHandleA:
000007fe`fdb831c0 4883ec48   sub   rsp,48h
0:000> kp
Child-SP   RetAddr           Call Site
00000000`0006fef8 00000000`004010b3 KERNELBASE!GetModuleHandleA
00000000`0006ff00 00000000`00000000 image00000000_00400000+0x10b3
0:000> u image00000000_00400000+0x10b3
image00000000_00400000+0x10b3:
00000000`004010b3 480bc0           or    rax,rax
00000000`004010b6 744b       je    image00000000_00400000+0x1103 (00000000`00401103)
00000000`004010b8 e80f000000 call  image00000000_00400000+0x10cc (00000000`004010cc)
00000000`004010bd 56         push  rsi
00000000`004010be 69727475616c50   imul  esi,dword ptr [rdx+74h],506C6175h
00000000`004010c5 726f       jb    image00000000_00400000+0x1136 (00000000`00401136)
00000000`004010c7 7465       je    image00000000_00400000+0x112e (00000000`0040112e)
00000000`004010c9 6374005a   movsxd      esi,dword ptr [rax+rax+5Ah]
0:000> bp image00000000_00400000+0x10b3
0:000> g

Breakpoint 4 hit
image00000000_00400000+0x10b3:
00000000`004010b3 480bc0           or    rax,rax
0:000> t
image00000000_00400000+0x10b6:
00000000`004010b6 744b       je    image00000000_00400000+0x1103 (00000000`00401103) [br=0]
0:000> t
image00000000_00400000+0x10b8:
00000000`004010b8 e80f000000 call  image00000000_00400000+0x10cc (00000000`004010cc)
0:000> t
image00000000_00400000+0x10cc:
00000000`004010cc 5a         pop   dx
0:000> t
image00000000_00400000+0x10cd:
00000000`004010cd 50         push  rax
0:000> t
image00000000_00400000+0x10ce:
00000000`004010ce 59         pop   rcx
0:000> t
image00000000_00400000+0x10cf:
00000000`004010cf e8bf000000 call  image00000000_00400000+0x1193 (00000000`00401193)
0:000> t
image00000000_00400000+0x1193:
00000000`00401193 ff25ab2e0000     jmp   qword ptr [image00000000_00400000+0x4044 (00000000`00404044)]
ds:00000000`00404044={kernel32!GetProcAddressStub (00000000`76d03630)}
0:000> t
kernel32!GetProcAddressStub:
00000000`76d03630 eb06       jmp   kernel32!GetProcAddress (00000000`76d03638)
0:000> t
kernel32!GetProcAddress:
00000000`76d03638 ff250aa10700     jmp   qword ptr [kernel32!_imp_GetProcAddress (00000000`76d7d748)]
ds:00000000`76d7d748={KERNELBASE!GetProcAddress (000007fe`fdb830e0)}
0:000> t

Breakpoint 2 hit
KERNELBASE!GetProcAddress:
000007fe`fdb830e0 48895c2408 mov   qword ptr [rsp+8],rbx ss:00000000`0006ff00={kernel32!BasepSxsCreateResourceStream <PERF> (kernel32+0x0) (00000000`76ce0000)}
Please note that we are using kernelbase as the first part of a symbol’s name. The first hit is with GetModuleHandleA. We inspect the call stack using the ‘kp’ command and set a breakpoint on the returning point from the API function. Again, we run the code and when our new breakpoint is hit, trace the unpacking process. You can quickly see how GetProcAddress is called. The rest of the process is the same as when using IDA.
In the previous section we had to do some manual work to make WinDbg stop at the process entry point. However, there is a much easier way to achieve the same thing, although it is buried deep within the user-unfriendly WinDbg documentation.
If we go back to our initial breakpoint screen set-up by WinDbg you will notice the following line:
ModLoad: 00000000`00400000 00000000`00405000 image00000000`00400000
We can use the image00000000`00400000 symbol as an argument to the $iment operator which is a leftover from MASM syntax (which for some time was the only syntax available in the Debugging Tools package). The $iment operator returns the address of the image entry point in the loaded module list and can be used when setting up breakpoints like this:
bp $iment(image00000000`00400000)
Now you can execute the module with the ‘g’ command and execution will stop at the entry point (00000000004040C2 in our case).
One of the PEB flags informs the process if it is being debugged. The same field is checked by the IsDebuggerPresent() Windows API function. Both flag and API function have been abused in the past to detect or to hide the presence of a debugger. Since this is such an important function and it accesses a crucial operating system structure, it is worth looking at – here is a disassembly generated with WinDbg:
KERNELBASE!IsDebuggerPresent:
000007fe`fdb8aee0 65488b042530000000     mov   rax,qword ptr gs:[30h]
000007fe`fdb8aee9 488b4860    mov  rcx,qword ptr [rax+60h]
000007fe`fdb8aeed 0fb64102    movzx      eax,byte ptr [rcx+2]
000007fe`fdb8aef1 c3          ret
000007fe`fdb8aef2 90          nop
000007fe`fdb8aef3 90          nop
000007fe`fdb8aef4 90          nop
000007fe`fdb8aef5 90          nop
First of all you may notice the symbol KERNELBASE, not kernel32 – this is the first difference from 32-bit Windows. Secondly, all the registers are 64-bit length. Furthermore, on x64 the GS register points to the Thread Environment Block (TEB, also called TIB), while on 32-bit Windows it is the role of the FS register, and GS is set to zero. Keep in mind, however, that in the case of applications running under the WOW64 layer, FS and GS registers behave just like they do on the regular 32-bit platform. TEB contains several pointers to other interesting and crucial Windows structures like PEB. WinDbg can be a great tool, enabling you to delve into core Windows structures. To get a peek into the TEB and find where the PEB pointer is located within the TEB we can use the ‘dt’ (display type) command:
0:000> dt _TEB @$teb
ntdll!_TEB
+0x000 NtTib      : _NT_TIB
+0x038 EnvironmentPointer : (null)
+0x040 ClientId       : _CLIENT_ID
+0x050 ActiveRpcHandle      : (null)
+0x058 ThreadLocalStoragePointer : 0x000007ff`fffde058 Void
+0x060 ProcessEnvironmentBlock : 0x000007ff`fffdb000 _PEB
+0x068 LastErrorValue       : 0x36b7
When debugging WinDbg set-ups, several virtual registers are encountered, including $teb and $peb which point to TEB and PEB respectively. We’ve used the $teb register for the display type command to inspect the current TEB. As you can see the 0x60 offset is a PEB pointer. This confirms the IsDebuggerPresent disassembly:
000007fe`fdb8aee9 488b4860 mov rcx,qword ptr [rax+60h]
Now let’s use the $peb register to inspect its content:
0:000> dt _PEB @$peb
ntdll!_PEB
  +0x000 InheritedAddressSpace : 0 ‘’
  +0x001 ReadImageFileExecOptions : 0 ‘’
    +0x002 BeingDebugged          : 0x1 ‘’
  +0x003 BitField                 : 0 ‘’
  +0x003 ImageUsesLargePages  : 0y0
  +0x003 IsProtectedProcess   : 0y0
As you can see, the field at offset 0x02 is BeingDebugged and unsurprisingly it is set to 1. Again, this is in line with our IsDebuggerPresent disassembly:
000007fe`fdb8aeed 0fb64102 movzx eax,byte ptr [rcx+2]
If you take a peek at the 32-bit version of IsDebuggerPresent you will find out that while the code is different, the algorithm is exactly the same.
Now you not only know about some important differences between 64- and 32-bit Windows, but also you know how to find other differences yourself.
While Microsoft Debugging Tools for Windows comes in 32- and 64-bit flavours it is possible to debug a WOW64 application using the x64 edition of WinDbg. Microsoft provides the Wow64exts debugger extension that can be loaded from 64-bit WinDbg using the ‘!load wow64exts’ command. This extension provides several new commands:
!wow64exts.sw – switches between native and 32-bit (x86 in MS nomenclature) modes
!wow64exts.k [count] – dumps a combined 32-/64-bit stack trace
!wow64exts.info – dumps basic information about the PEB and current thread TEB plus TLS slots used by WOW64
!wow64exts.r [address] – dumps context for the specified address. If no address is specified then the context of the CPU will be dumped.
If you are willing to use both the 32- and 64-bit edition of MS Debugging Tools under an x64 system, remember that 32-bit tools are not able to disassemble and set breakpoints within the WOW64 thunk layer since this is 64-bit code.
DLL injection can be used both by malware and reverse engineers during code analysis in some cases. It can be useful in some advanced unpacking techniques. The SetWindowsHookEx() function is available in 64-bit mode, however you have to remember that the DLL to be injected must be for the same mode as the process you are trying to inject the library into. In short: you can inject a 64-bit (native) DLL into a native process and a 32-bit DLL into an x86 process. This also means that 32-bit and 64-bit DLLs must have different names.
As it turns out, it’s not always about the tool we use but how well we understand the inner workings and how well we can handle and exploit our toolset capabilities. Learning to use another tool for a job which we handle perfectly well with a different one can only be an advantage. Sometimes correlating results from different tools can provide very useful information. Of course, none of the methods presented here scale well. They are all only suitable for a manual unpacking process.
[1] Microsoft Windows Debugging Tools. http://msdn.microsoft.com/en-us/windows/hardware/gg463009.aspx.
[4] Microsoft Portable Executable and Common Object File Format Specification. http://msdn.microsoft.com/en-us/library/windows/hardware/gg463119.aspx.