2013-04-04
Abstract
In the first and second parts of this series Aleksander Czarnowski covered the background information needed to understand the principles of ARM shellcoding and dissected some previously crafted shellcode. In this final part, he looks at some more advanced topics, including polymorphic shellcode and methods for its analysis.
Copyright © 2013 Virus Bulletin
In the previous parts of this series we discussed the background information needed to understand the principles of ARM shellcoding [1] and dissected some previously crafted shellcode [2]. In this follow-up piece we will look at some more advanced topics such as polymorphic shellcode and methods for its analysis.
All of what we’ve done so far has been in preparation for the more challenging task of analysing polymorphic ARM shellcode with IDA Pro. Before we go any further, let’s start with a bit of theory.
Polymorphic shellcode is clearly possible on ARM, and the principles are almost the same as in the case of x86/x64 architectures. For the decryption loop, simple operations such as subtraction, addition and exclusive-or are used. The latter is the most commonly exploited due to its nature (the encryption loop becomes a decryption loop on the next run).
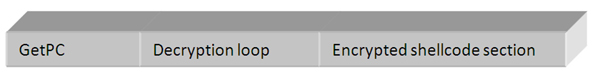
The basic polymorphic shellcode layout is the same on ARM as on x86 – see Figure 1.
It is worth mentioning that the decryption loop can be attached to any other basic shellcode – this means that encrypted shellcode can repeat the GetPC operation and switch back and forth between ARM and Thumb mode, ignoring any actions taken earlier by the decryption loop (also called a decryptor). There are two issues each time self-modifying code emerges: cache and memory protection – but both, for various reasons, are beyond the scope of this tutorial.
Obviously, to fully analyse polymorphic shellcode you have to decrypt the encrypted sections. This can be done using one of four different approaches:
Try to execute the decryption loop in order to decrypt the rest of the code.
Try to emulate the decryption loop in order to decrypt the rest of the code.
Try to rewrite the decryption algorithm and re implement it with IDC or IDAPython.
Try to brute force the decryption loop and check for reasonable disassembly output (for example, in userland ARM shellcode for Linux, you can expect there to be an SVC call).
In many cases the fourth method may not be feasible. On the other hand, executing code on real hardware can be tricky. Rewriting the decryption loop can be done quickly in the case of simple algorithms and a single decryption layer, but with an increase in algorithm complexity and/or number of encryption layers, this could become time consuming and prone to error. The emulation approach seems promising, but unfortunately the ida x86emu plug-in [3] does not support ARM platforms. However, IDA Pro provides another emulation option for ARM architectures: the qemu plug in. Qemu comes with a gdb stub which can be controlled remotely from IDA Pro. We will be using this option from this point on, but first we need to find a reasonable target. As a comparison to our previous target we will use different, polymorphic execve() ARM Linux shellcode [4]. At 78 bytes it is not too long for our exercise:
Compile the shellcode wrapper and dump the shellcode to file with the IDAPython script provided. Alternatively, you can extract the shellcode bytes directly from the source file (which will be quicker).
Start a new IDA Pro session and open your polymorphic shellcode dump.
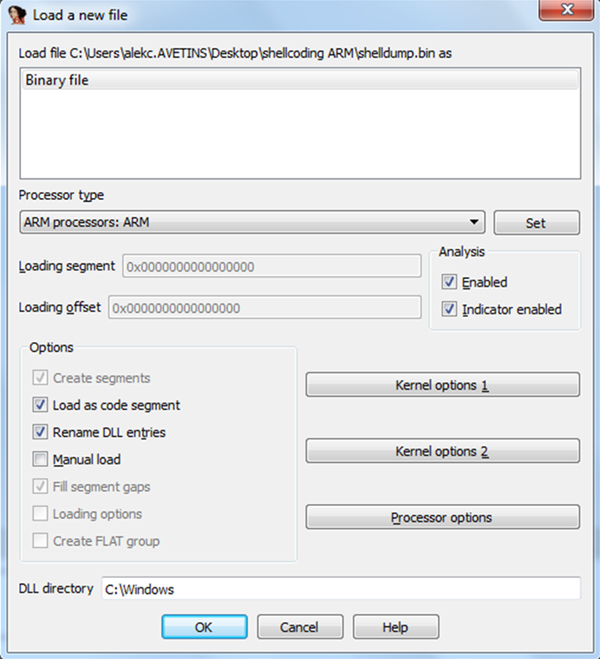
When loading the binary file, set the processor to ARM, as shown in Figure 2 – IDA will prompt for this setting automatically.
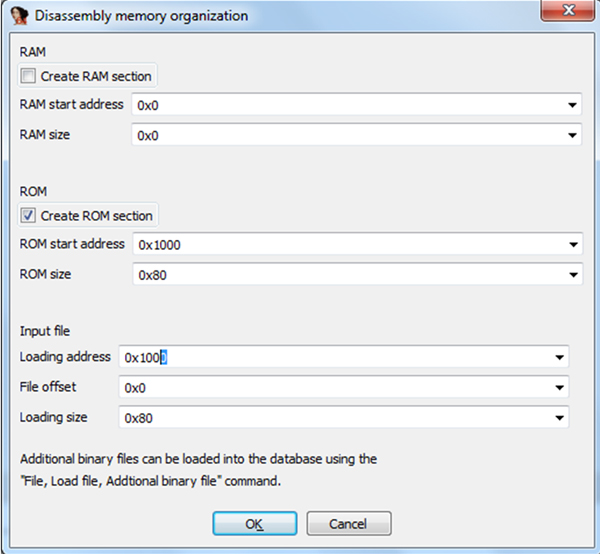
After selecting the processor family IDA will ask for the memory layout, as shown in Figure 3. Create a ROM section and place it at an even address that will be easy to calculate (remember all ARM CPU instructions are either two or four bytes long – this is quite different from x86/AMD64 architecture). 0x1000 seems to be a good choice since ARM should not be keeping any structures in this address space. Do not use 0x00 or a very high address since you can locate your code at the interrupt vector table. Also set the ‘Load address’ field in the ‘Input file’ frame accordingly. Note that IDA will use the file size to calculate the ‘ROM size’ and ‘Loading size’ fields. Unless you have a nop slide that you don’t want to analyse, set the ‘File offset’ form field to 0x0. This will load the whole dump at the starting address.
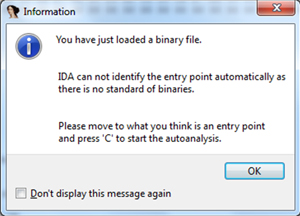
IDA will warn you of its inability to detect an entry point (see Figure 4). Accept this, since we assume that 0x1000 is our entry point.
When the file finishes loading, convert the shellcode dump into code (‘C’ key from disassembly view).
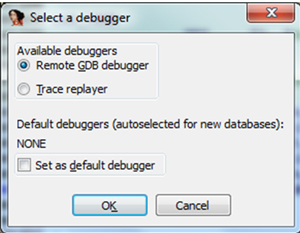
Now select GDB from the ‘Debugger’ menu, as shown in Figure 5 (note that if you were to load an ARM ELF file you would get a third option: Remote ARM Linux/Android debugger).
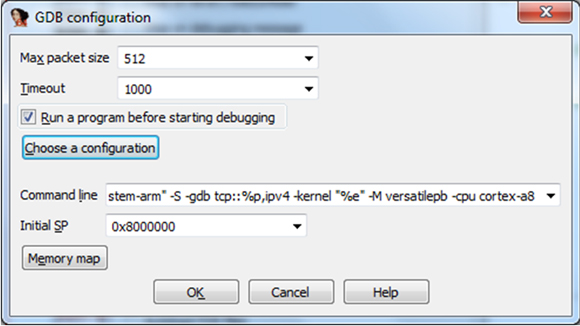
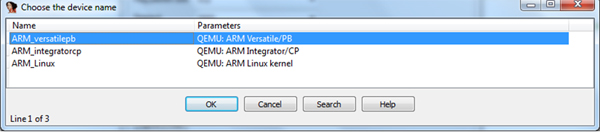
Next, select ‘Debugger’->‘Debugger options…’ ->‘Set specific options’ and in the ‘GDB configuration’ window (see Figure 6) tick the ‘Run the program before debugging starts’ check box. This will enable the ‘Choose a configuration’ button. Click it. This will cause the next window to appear, as shown in Figure 7: ‘Choose the device name’.
Select the ‘QEMU:ARM Versatile/PB’ option and click ‘OK’.
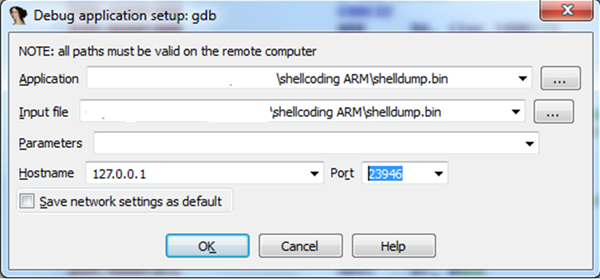
The command line and initial SP fields in the ‘GDB configuration’ window should now be filled automatically. Click the ‘OK’ button. Make sure that you have the correct localhost and ports settings, as shown in Figure 8.
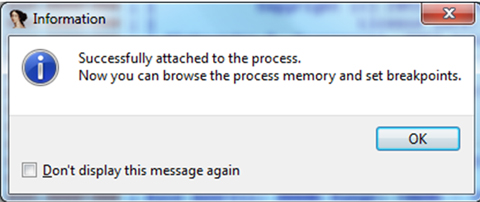
Start the debugger by pressing F9 – you will see a couple of warnings regarding the dangers of running untrusted code etc. Accept those and wait for a message informing you that the debugger has been connected successfully (Figure 9).
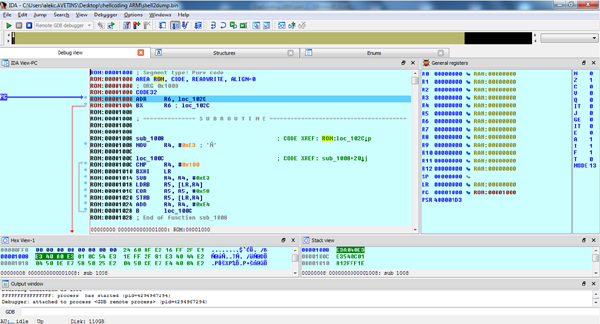
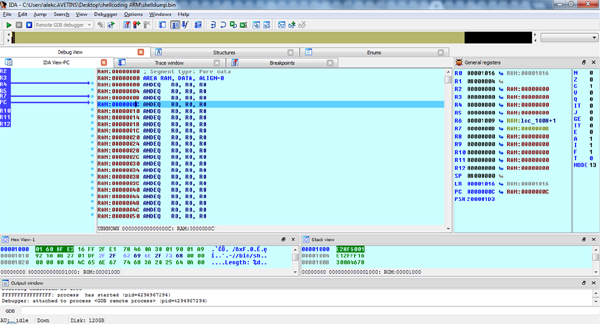
The PC register should be pointing at the 0x1000 address and parts of the code should be disassembled, as shown in Figure 10.
(Click here to view a larger version of Figure 10.)
Now enable ‘Instruction tracing’ from the ‘Debugger’- >‘Tracing’ menu – later this will allow us to analyse how the shellcode decrypted the rest of its sections. We are now ready to analyse the shellcode.
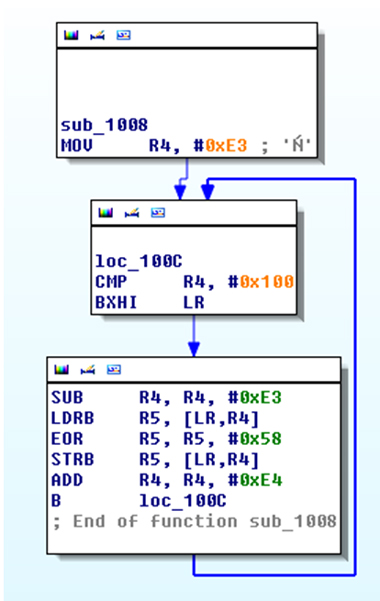
One of the nice features of recent versions of IDA is the ‘proximity view’ [5]. We can use it to visualize the execution flow of the shellcode, as shown in Figure 11. Note that without additional manual help, IDA will not be able to recognize the shellcode entry point as a function and therefore the graph view will not be available. However, we can use the graphs feature when we enter the decryption loop starting at 0x1008 (sub_1008). Take a look at the graph in Figure 12.
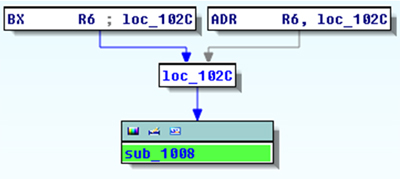
Figure 11. Using the ‘proximity view’ option to show trampoline code at the beginning of the shellcode.
What is missing from the graph is a loop exit using the BXHI LR instruction based on the R4 register value comparison. Nevertheless, IDA does a great job of graphing out of the box. This is another thing we could fix either manually or through a plug-in, but in this case there is no point.
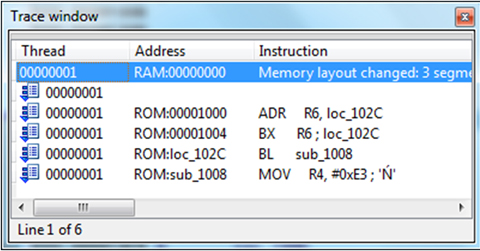
Now we can start debugging using the ‘Single-Step’ option (F7 key). First, the GetPC trampoline construction must be executed. Figure 13 shows the instruction trace log (thanks to the ‘Instruction tracing’ option which we enabled immediately after running the debugger).
The first R6 register is loaded with a pointer to the second jump. Since the instruction occupies four bytes we are in ARM mode. Next, the BX branch instruction is used to transfer execution flow to the 0x102C address where another branch (with link) instruction (BL) jumps back to 0x1008. Since the BL instruction stores the return address in the LR register, LR will now point to the encrypted data section of the shellcode.
Next is the decryption loop, as shown in Figure 12, and a quick analysis, even without debugging, reveals that it is based on an exclusive-or operation with a key value of 0x58. The following instruction:
0x1018 LDRB R5, [LR,R4]
uses the LR register as a base pointer to the shellcode data section, and this instruction:
0x1020 STRB R5, [LR,R4]
writes back data after XOR’ing with 0x58. The LR register is used again as a base pointer. The R4 register is used as a counter and, together with the LR register, forms the final pointer for the decryption process. This is why the previous BX->BL trampoline construction was used.
Single stepping through the encryption loop will not provide us with any more details, so we can use the first loop iteration to set a breakpoint at the first decrypted instruction. Using the LR register value we know that the correct address is 0x1030. Place a breakpoint at this address and run a decryption loop (F9 key). The first decrypted instruction is:
0x1030 ADR R3, 0x1039
Move the cursor down and convert the rest of the unencrypted shellcode to code (‘C’ key). The next instruction is a well known BX:
0X1034 BX R3 ; LOC_1038
This time BX is not really used as a branch instruction but just to switch from ARM to Thumb mode again. This is because the BXHI instruction switched from Thumb to ARM when exiting the decryption loop. Starting from 0x1038 (the first instruction following the BX branch), another well known construction is used to load registers with proper values to prepare for the system call (the SVC 1 instruction). The data section containing the string for the system call is located after the SVC instruction starting from 0x1046. Since the R7 register in the Linux calling convention contains function number (0x0B), in this case we already know this is execve().
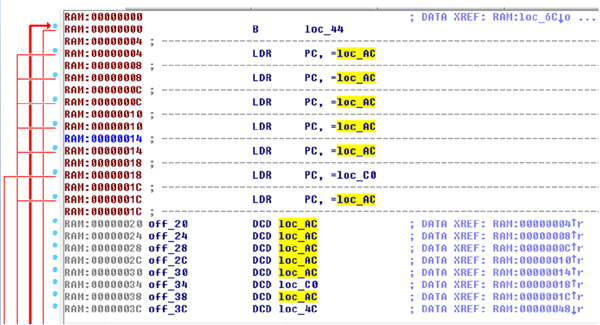
If you continue single stepping and try to execute the SVC instruction, the PC register will point to the 0x000C address (Figure 14).
(Click here to view a larger version of Figure 14.)
This address contains the ANDEQ R0, R0, R0 instruction, which is encoded as four zeros. In a true system, however, this location is part of the ARM exception vector table. An example of how this table should be set up is shown in Figure 15. Obviously this table can be used by malware to hook critical system operations as well. The table is set up by firmware during the power-on cycle, however our system is just a simple emulation based on qemu with no kernel image or bootloaders/firmware image loaded. For more advanced analysis tasks you can either set up your own table or load true firmware and kernel images into the appropriate address space. Also note that the exception vector table can start either from the beginning or from the top of system memory – the location on system start up is a configurable option for ARM and can differ from one ARM based System on Chip (SoC) to another.
(Click here to view a larger version of Figure 15.)
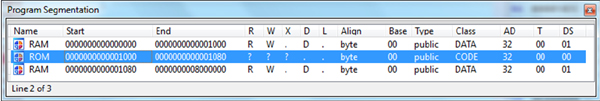
When we reach the end of the shellcode we should save our work. In order to synchronize the IDA disassembly database with the debugger and import the decryption loop results we need to edit segments by opening the ‘Segments’ sub-view (Shift+F7) and pressing Ctr+E after selecting the ‘ROM’ segment, as shown in Figure 16.
(Click here to view a larger version of Figure 16.)
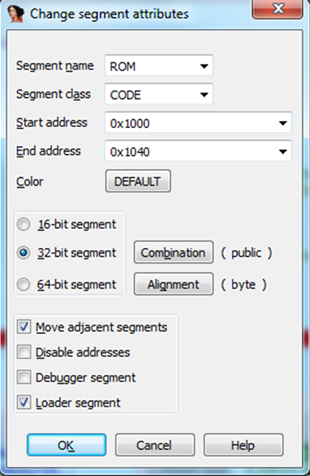
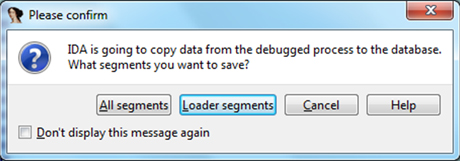
In the ‘Change segment attributes’ window (Figure 17) tick ‘Loader segment’ and make sure that the ‘Debugger segment’ checkbox is disabled, since debugger segments are discarded automatically when leaving the IDA debugger. Now we are ready to take a memory snapshot. When you choose the ‘Take memory snapshot’ option, a message (Figure 18) will be displayed: select ‘Loader Segments’ in order to save proper code areas into the database. Note that if you skip the segment edition this option would not be available unless some segments were marked earlier for one reason or another. Your work is done.
You might be wondering whether alphanumeric shellcode is possible on ARM architecture. The answer is yes, and there are a few good publications that discuss it [6], [7], [8]. [8] shows how to analyse the shellcode presented in [6] using IDA Pro. The analysis process does not differ from what has been discussed so far and all techniques described apply to alphanumeric shellcode as well.
ARM can be a strange platform both for newcomers and for diehard x86 assembly language programmers. Once you get a grasp of a few differences and tricks it becomes nice, easy and predictable. Sooner or later you will come to love the constant length of instructions. Compared with x86 there is quite a limited set of options for writing reliable shellcode for particular operating platforms. This may be disappointing if you are looking for a long term challenge because after a certain number of shellcodes the next thousand will look similar if not exactly the same – but isn’t that the case with other types of malware as well?
[1] Czarnowski, A. Shellcoding ARM. Virus Bulletin, January 2013, p.9. http://www.virusbtn.com/pdf/magazine/2013/201301.pdf.
[2] Czarnowski, A. Shellcoding ARM: part 2. Virus Bulletin, March 2013, p.14. http://www.virusbtn.com/pdf/magazine/2013/201303.pdf.
[3] ida-x86emu plug-in. http://www.idabook.com/.
[4] Linux/ARM - Polymorphic execve(“/ bin/sh”, [“/bin/sh”], NULL); - XOR 88 encoded - 78 bytes. http://www.exploit-db.com/exploits/14190/.
[5] Proximity Viewer. IDA Pro online help. https://www.hex-rays.com/products/ida/support/idadoc/1626.shtml.
[6] Younan, Y.; Philippaerts, P. Alphanumeric RISC ARM Shellcode. Phrack #66. http://www.phrack.org/issues.html?issue=66&id=12.
[7] Skochinsky, I. Debugging ARM code snippets in IDA Pro 5.6 using QEMU emulator. http://www.hexblog.com/?p=111.
[8] Younan, Y.; Philippaerts, P.; Piessens, F.; Joosen, W.; Lachmund, S.; Walter, T. Filter-resistant Code Injection on ARM. http://dl.acm.org/citation.cfm?id=1653665.